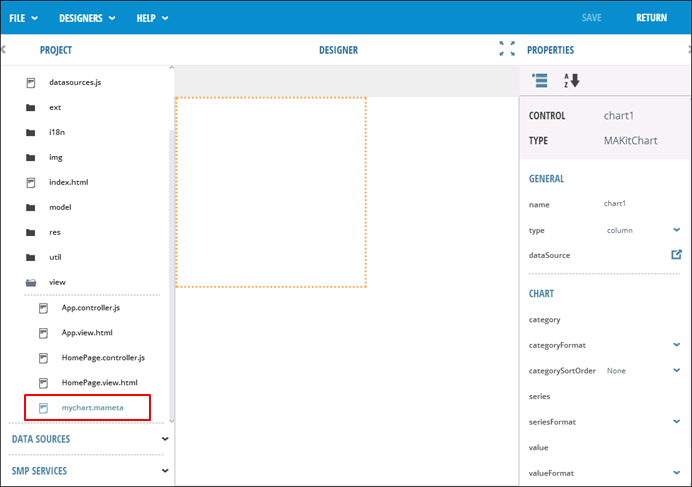
Use the Chart Designer to create a new chart
A chart is a control that graphically displays data from a datasource. To create the chart, create a metadata file and add it to the chart control following these steps:
- In the wizard, enter a name for the metadata, for example, and click
Confirm.The metadata file is created under the view folder in the Project Explorer.
- Bind data to the control.
- Go to the Properties panel and select the dataSource icon.
- In the data binding catalog, select the data source, and click Confirm.
The Data Source is added to the dataSource property for the chart.
- Configure the chart control.
- In the Properties panel, click type to select the chart type, for example Column.
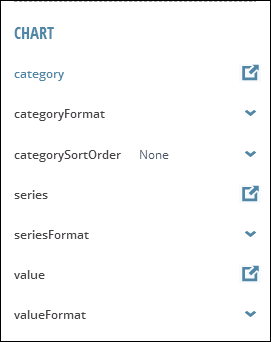
- In the Properties panel, specify the control properties for the chart. Note: Important notes for configuring chart properties:
- The category and value properties are required properties that must be set. The series property is optional.
- Sorting – AppBuilder's charting feature requires its data to be sorted by category column. If you set the categorySortOrder to None, then you need to make sure the date is pre-sorted by category. It doesn't matter how it is sorted (for example, alphabetically), as long as it is sorted.
- Duplicated Data – AppBuilder's charting feature does not automatically aggregate data, and it expects that each row of data is unique based on category and series (if the series property is set). If there are rows in the data with the same category and series values, the duplicate row is removed, and the data is only displayed once on the Chart.