![]()
Click the New button in the PowerBar.

The New dialog box displays.
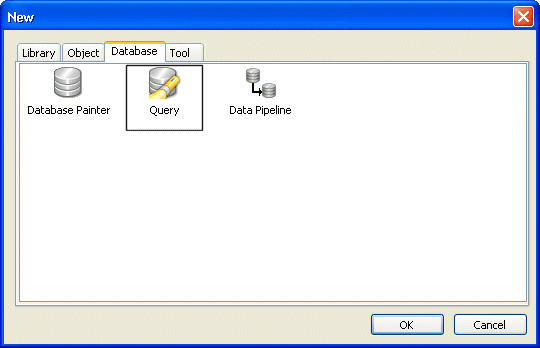
Select the Database tab and the Query icon.
Click OK.
InfoMaker connects to the database, and the Select Tables dialog box displays. In this dialog box you can select one or more tables to use.
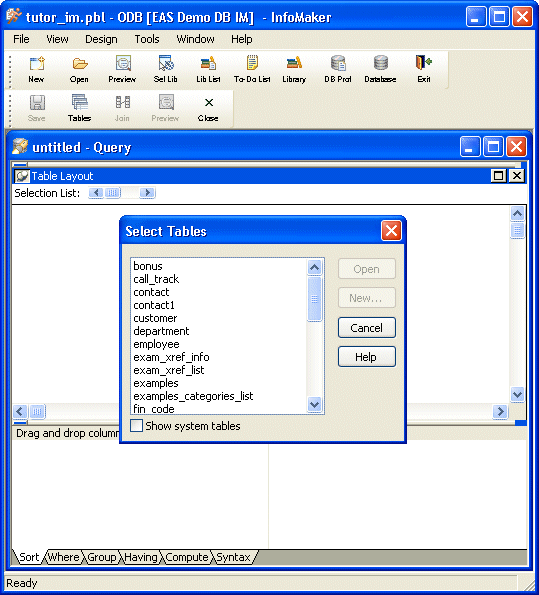
You are going to use two of the tables.
Click the tables named fin_code and fin_data.
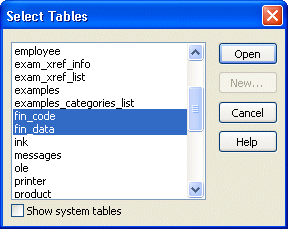
Click Open.
The fin_code and fin_data tables display. Both tables have a code column. The tables are joined on the code column.
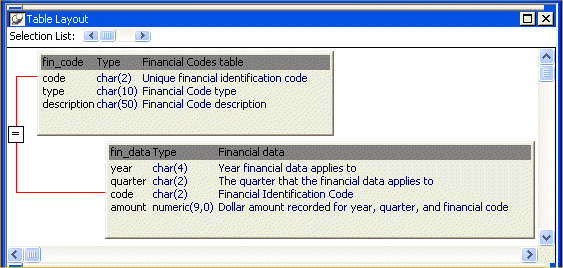
If your display does not include all the information shown in the picture, right-click in the Table Layout view and select the information you want to display from the Show menu.
The fin_data table has a code value in each row to indicate what the row of data applies to (for example, r1 means revenue from fees).
The fin_code table stores information about codes, including the actual values (such as r1 and e4), the type of each code (revenue or expense), and a description of each code.
Next you select columns from the tables.
Click year in the fin_data table.
Click quarter in the fin_data table.
Click amount in the fin_data table.
Click type in the fin_code table.
Click description in the fin_code table.
When you click each column, it is highlighted in the table and added to the selection list above the tables.
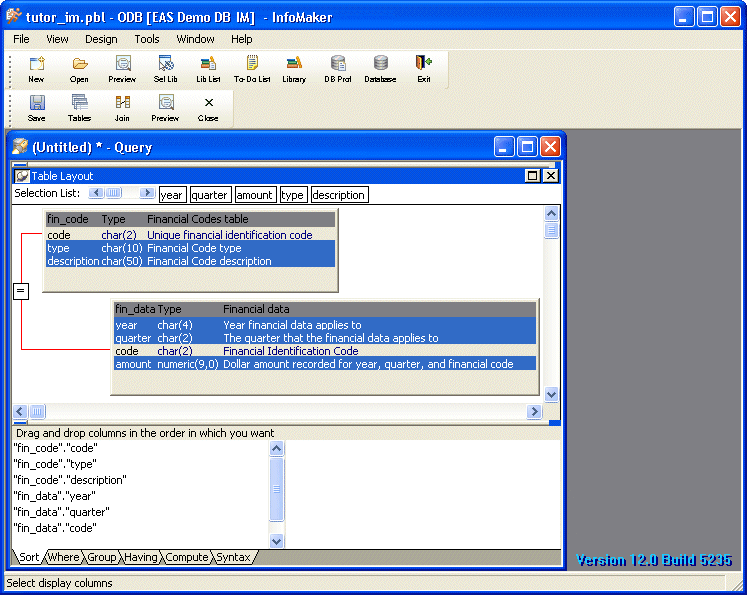
Select Design>Preview from the menu bar.
You can see the results of your query. InfoMaker uses your query as it is currently defined to access the database and retrieve data.
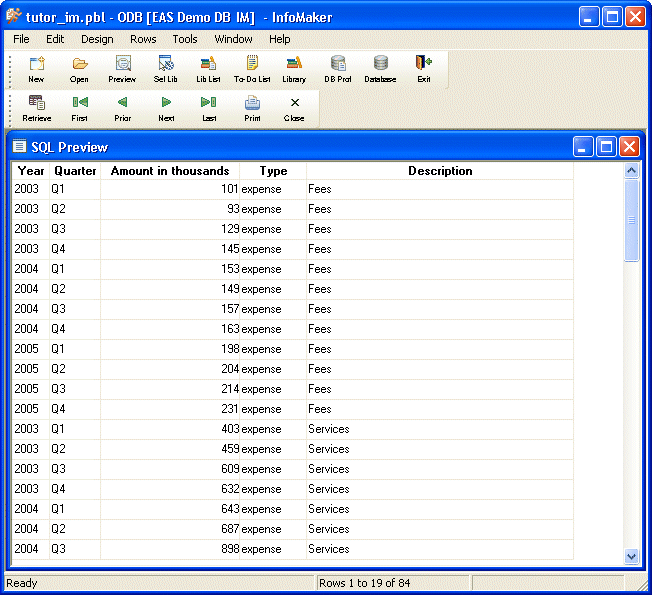
Use the scroll bar to view the data.
Each row has either the word expense or the word revenue in the Type column. First you save the query and then you use the value in the Type column to select rows for the query.
Select File>Close from the menu bar.
You return to the workspace.