Administration Portal - Statistics
The Statistics panel is used to view statistics in the following three areas:
- Communication Session Statistics
- Application BAPI Wrapper Call Statistics
- Push Scenario Statistics
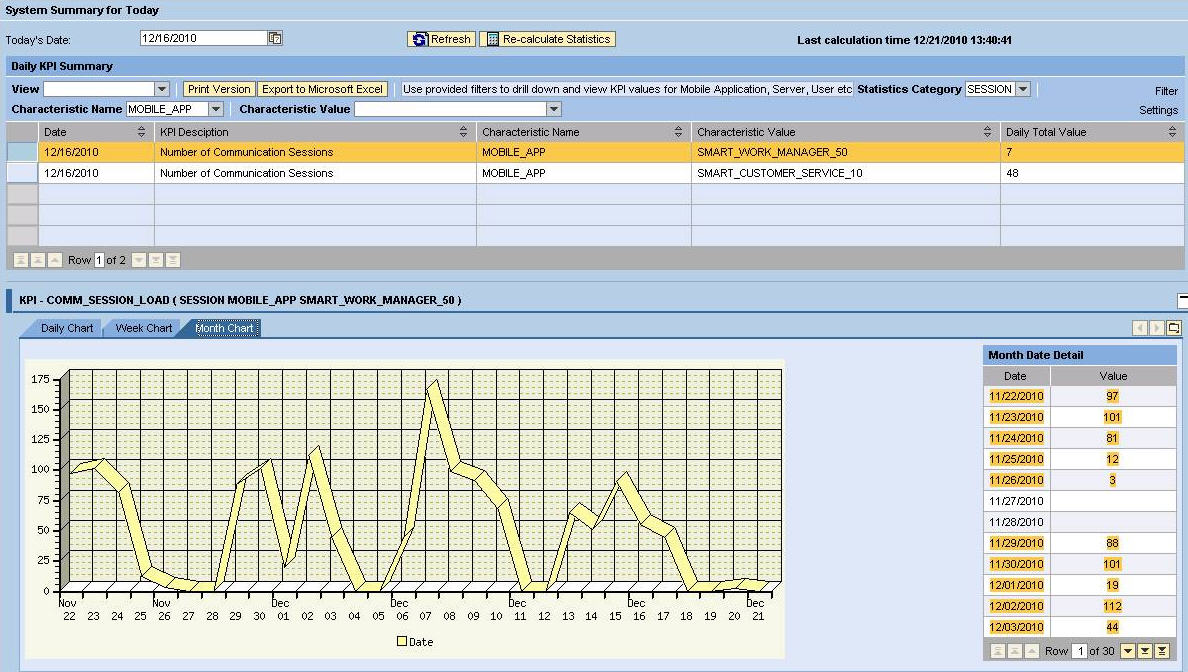
The statistics panels display graphical views of various key performance indicator (KPI) data. The Statistics panels are view-only. An administrator cannot create new information or change existing information through these panels.
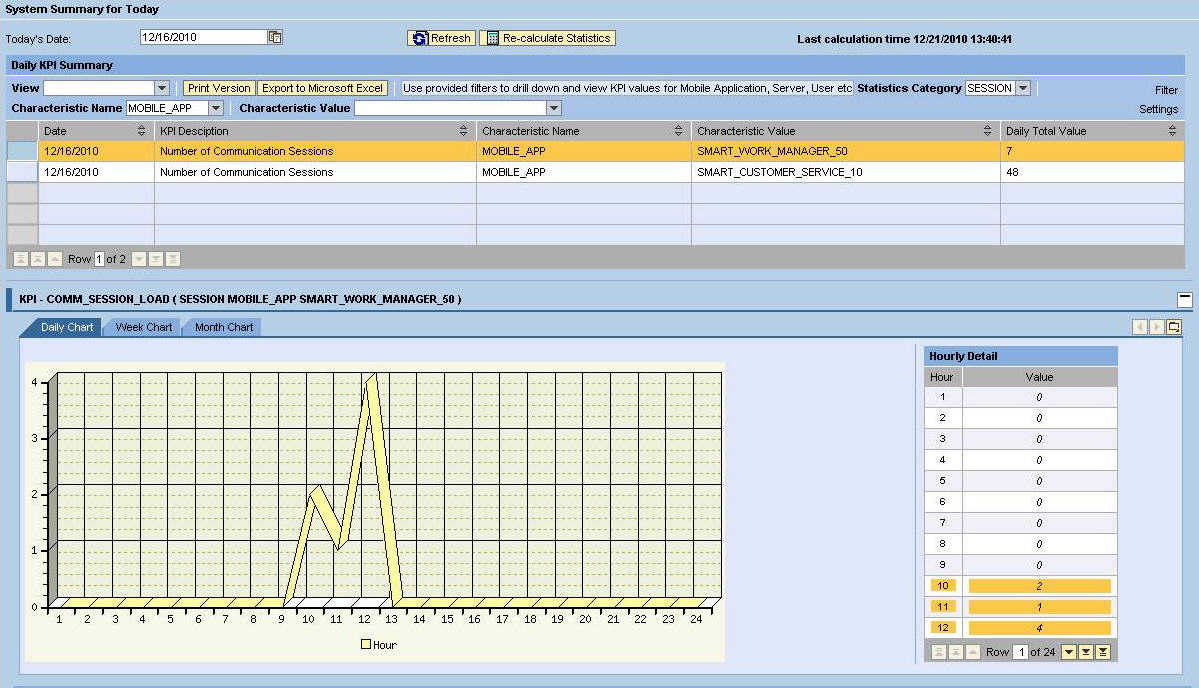
There are three tabs for each statistic, each allowing a different graphical view: Daily, Weekly, and Monthly. The following examples depict a representation of each type of graph.
The Daily Chart tab shows a graphical representation of the chosen statistics broken down into hours.
The Weekly Chart tab shows a graphical representation of the chosen statistics broken down into days, with a total of seven days.

The Monthly Chart tab shows a graphical representation of the chosen statistics broken down into days, with a total of the amount of days in the selected month.