Statistics - Communication Session Statistics
The KPIs available through the Communication Session Statistics panel display information on the system operation status for the chosen date.
Statistics - Communication Session Statistics
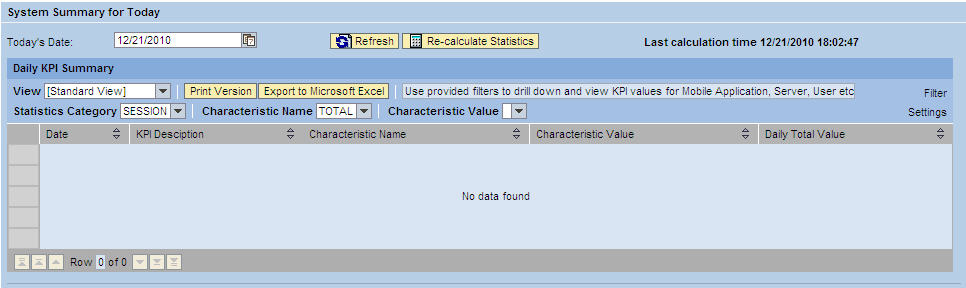
Daily KPI Summary
- View: If the administrator sets up different views using the Settings link, the drop-down menu will display those view names. Select a different view for specific data needs.
- Print Version: If enabled, creates a PDF version of the data in the Search Results table.
- Export to Microsoft Excel: Exports all data in the Search Results table to an Excel spreadsheet
- Statistics Category/Characteristic Name/Characteristic Value: Use to filter statistics further. Select from the choices available through the dropdown menus. If the field is blank, no choices are available.
- Filter/Delete Filter: If the Filter tab is utilized in the Settings window accessed by the Settings link, click the Filter link to display filter choices in order to further filter the data displayed. If a filter is in use, click Delete Filter to remove the filter and display all data returned by the initial search performed.
- Settings: Click this link to display a Settings panel in order to modify how search results are displayed. See the section on changing Administrator settings for more details.
- Daily KPI Summary table: Contains rows that display which
statistics are available for the selected date. Highlight a row
to display that graph. The graphs available are as follows:
- KPI - COMM_SESSION_LOAD: The KPI - COMM_SESSION_LOAD is a graphical representation of the system load for the date chosen. The more sessions there are per hour, the heavier the load on the system, which could cause performance issues. Session load statistics are based on the number of sessions connecting; it does not take into account duration of the sessions.
- KPI - CONNECTING_USER_COUNT: The KPI - CONNECTING_USER_COUNT is a graphical representation of the total users connecting to the system for the date chosen. Data gathered for this graph does not take into account a single user logging into multiple sessions; it only counts unique user IDs connecting to the system.
Parent topic: Administration Portal - Statistics