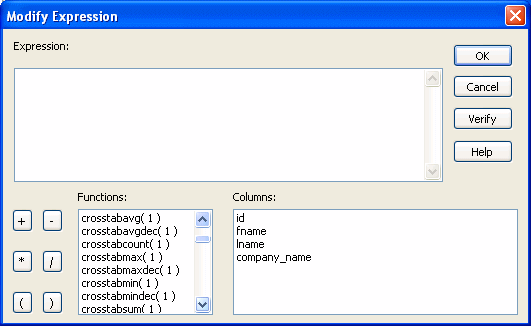
There are nine special functions you can use only in crosstabs: CrosstabAvg, CrosstabAvgDec, CrosstabCount, CrosstabMax, CrosstabMaxDec, CrosstabMin, CrosstabMinDec, CrosstabSum, and CrosstabSumDec.
These functions are listed in the Functions box when you define a computed field in a crosstab:

Each of these functions returns the corresponding statistic about a row in the crosstab (average, count, maximum value, minimum value, or sum). You place computed fields using these functions in the detail band in the Design view. Use the functions with the Dec suffix when you want to return a decimal datatype.
By default, PowerBuilder places CrosstabSum and CrosstabSumDec in the detail band, which returns the total for the corresponding row.
Each of these functions takes one numeric argument, which refers to the expression defined for Values in the Crosstab Definition dialog box. The first expression for Values is numbered 1, the second is numbered 2, and so on.
Generally, crosstabs have only one expression for Values,
so the argument for the crosstab functions is 1. So, for example,
if you defined sum(units for crosstab) as
your Values expression, PowerBuilder places CrosstabSum(1) in
the detail band.
If you want to cross-tabulate both total unit sales and a projection of future sales, assuming a 20 percent increase in sales (that is, sales that are 1.2 times the actual sales), you define two expressions for Values:
sum(units for crosstab)
sum(units * 1.2 for crosstab)
Here CrosstabSum(1) returns
the total of sum(units for crosstab) for the
corresponding row. CrosstabSum(2) returns
the total for sum(units * 1.2 for crosstab).
For complete information about defining computed fields, see Chapter 19, “Enhancing DataWindow Objects.”
For more about the crosstab functions, see the DataWindow Reference.