![]()
![]()
![]()
![]()
You can build a crosstab where each row tabulates a range of values, instead of one discrete value, and you can make each column in the crosstab correspond to a range of values.
For example, in cross-tabulating departmental salary information, you might want one row in the crosstab to count all employees making between $30,000 and $40,000, the next row to count all employees making between $40,000 and $50,000, and so on.
![]() To cross-tabulate ranges of values:
To cross-tabulate ranges of values:
Determine the expression that results in the raw values being converted into one of a small set of fixed values.
Each of those values will form a row or column in the crosstab.
Specify the expression in the Columns or Rows box in the Crosstab Definition dialog box.
You choose the box depending on whether you want the columns or rows to correspond to the range of values.
In the Values column, apply the appropriate aggregate function to the expression.
This is best illustrated with an example.
You want to know how many employees in each department earn between $30,000 and $40,000, how many earn between $40,000 and $50,000, how many earn between $50,000 and $60,000, and so on. To do this, you want a crosstab where each row corresponds to a $10,000 range of salary.
The first step is to determine the expression that, given a salary, returns the next smaller salary that is a multiple of $10,000. For example, given a salary of $34,000, the expression would return $30,000, and given a salary of $47,000, the expression would return $40,000. You can use the Int function to accomplish this, as follows:
int(salary/10000) * 10000
That expression divides the salary by 10,000 and takes the integer portion, then multiplies the result by 10,000. So for $34,000, the expression returns $30,000, as follows:
34000/10000 = 3.4
int(3.4) = 3
3 * 10000 = 30000
With this information you can build the crosstab. The following uses the Employee table in the EAS Demo DB:
Build a crosstab and retrieve the dept_id and salary columns.
In the Crosstab Definition dialog box, drag the dept_id column to the Columns box.
Drag the salary column to the Rows box and to the Values box and edit the expressions.
In the Rows box, use:
int(salary/10000) * 10000
In the Values box, use:
count(int(salary/10000) * 10000 for crosstab)
For more on providing expressions in a crosstab, see “Using expressions”.
Click OK.
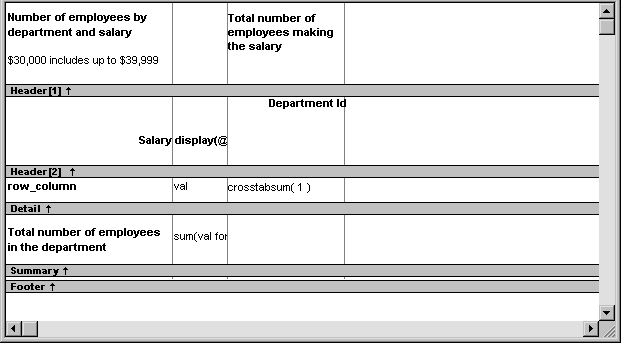
This is the result in the Design view:
This is the crosstab at runtime:
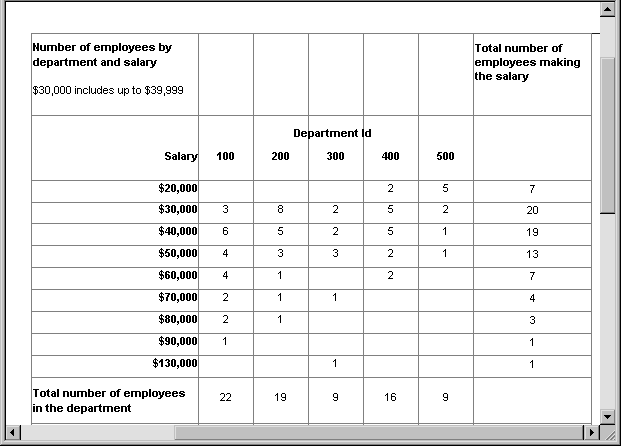
You can see, for example, that 2 people in department 400 and 5 in department 500 earn between $20,000 and $30,000.
In the preceding crosstab, several of the cells in the grid are blank. There are no employees in some salary ranges, so the value of those cells is null. To make the crosstab easier to read, you can add a display format to fields that can have null values so that they display a zero.
![]() To display blank values in a crosstab as zero:
To display blank values in a crosstab as zero:
Select the column you want to modify and click the Format tab in the Properties view.
Replace [General] in the Format
box with ###0;###0;0;0.
The fourth section in the mask causes a null value to be represented as zero.
