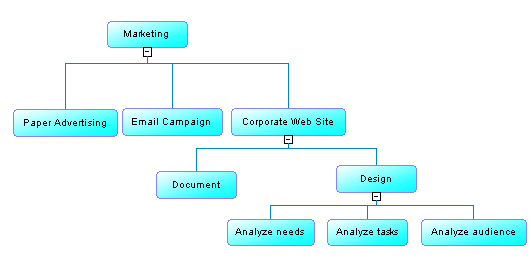
A process hierarchy diagram (or functional decomposition diagram) provides a graphical view of the functions of a system and helps you decompose them into a tree of sub-processes.
The PHD is commonly used during the analysis phase of a project to identify all the processes in a system by name, and decompose them into multiple levels of sub-processes.
In the following example, the root process, Marketing, is decomposed into three sub-processes, Paper Advertising, Email Campaign, and Corporate Web Site. The latter is in turn decomposed into two sub-processes, and so on:

|
To create a ... |
Click... |
Cursor | Example |
|---|---|---|---|
|
Root process |
Any empty space in the diagram window. |
 |
 |
|
Sub-process |
A root process symbol or the bottom part of any other process. |
 |
 |
|
Sibling process |
The left or right part of any process symbol, except the root process. |

 |
 |
- Expand and collapse children under a process by clicking the + or - sign on the base of the symbol. Alternatively, right-click a process and select Expand to show one level of children, Expand All to show all levels, or Collapse to hide all children.
- Change the parent of a subprocess by dragging and dropping it from one process to another.
- Evenly distribute the sub-processes beneath a process in harmonious lines by right-clicking it and selecting Arrange Symbols, or selecting .
- By default, a process hierarchy displays from top-to-bottom. To display it from left-to-right, select , and select Horizontal in the Orientation group box.
- Hide a process and its children in the hierarchy without deleting it in the model by right-clicking it and selecting . To display any hidden sub-processes underneath a process, right-click it and select Complete or Complete All.
Each of these processes can be analyzed in its own business process diagram (see Business Process Diagrams (Analysis)). You can create a default business process diagram for any of the processes by right-clicking it and selecting Build Default Flows between Processes. The default flow links subprocesses in the first level beneath the process between a start and an end. You can further refine the control flow by creating other objects in the diagram.