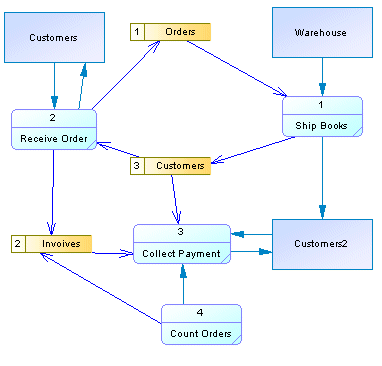
The Data Flow Diagram (DFD) is a graphical representation of the flow of data through an information system. It enables you to represent the processes in your information system from the viewpoint of data. The DFD lets you visualize how the system operates, what the system accomplishes and how it will be implemented, when it is refined with further specification.
Data flow diagrams are used by systems analysts to design information-processing systems but also as a way to model whole organizations. You build a DFD at the very beginning of your business process modeling in order to model the functions your system has to carry out and the interaction between those functions together with focusing on data exchanges between processes. You can associate data with conceptual, logical, and physical data models and object-oriented models.

-
Logical data flow diagrams - are implementation-independent and describe the system, rather than how activities are accomplished.
-
Physical data flow diagrams - are implementation-dependent and describe the actual entities (devices, department, people, etc.) involved in the current system.
DFDs can also be grouped together to represent a sub-system of the system being analyzed.
In addition to PowerDesigner's standard Toolbox, a Data Flow Diagram toolbox is available to let you rapidly create objects specific to the diagram type:
|
Concept |
Tool |
Gane & Sarson |
Yourdon |
Description |
|---|---|---|---|---|
|
Process |

|
 |
 |
Location where data is transformed. See Processes (DFD). |
|
Flow |

|
 |
 |
Oriented link between objects, which conveys data. See Flows (DFD). |
|
Data store |

|
 |
 |
Repository of data. See Data Stores (DFD). |
|
External entity |

|
 |
 |
Source or destination of data. See External Entities (DFD). |
|
Split/Merge |

|
 |
 |
Splits a flow into several flows or merges flows from different sources into one flow. See Split/Merges (DFD). |
-
Support for the Gane & Sarson and Yourdon notations, which you choose between by selecting .
-
Automatic processes and data stores numbering (see DFD Process and Data Store Numbering).
-
Data flow diagram balancing (see DFD Balancing).
- Data Flow Diagram specific validation rules (F4) - PowerDesigner may perform automatic corrections to your model or output errors and warnings that you will have to correct manually.
This chapter outlines the specifics of PowerDesigner's support for data flow diagrams, and should be read in conjunction with Business Process Diagrams.