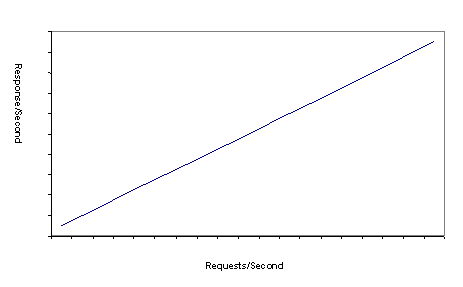

Ideally, an applications request rate relates linearly to response rate as shown in Figure 9-1.
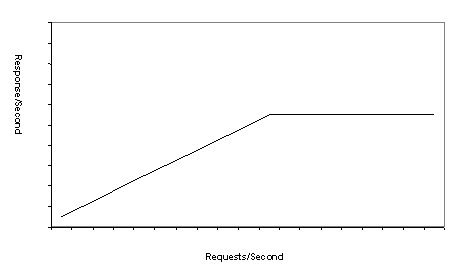
However, performance of any application depends on availability of resources like CPU, memory, network connections, and swap space. These resources are limited, and when they are exhausted, the response rate degrades. Due to resource limits, the response rate is expected to level off when the number of incoming requests reaches the point where resources are exhausted, as shown in Figure 9-2. However, in practice, an unlimited increase in incoming requests can cause performance to degrade; the response rate can drop in this case. In extreme cases, the application may run out of memory and abend or hang.
Figure 9-1: Ideal response rate curve

Figure 9-2: Expected response rate curve

Performance Monitor allows you to configure the system to operate at a constant response rate and avoid out-of-memory conditions under high load conditions. Performance Monitor uses these algorithms to heuristically govern the request rate when high load conditions are detected:
Memory monitoring You can configure thresholds for memory usage. EAServer monitors the memory used and blocks external requests when the critical threshold is reached.
Response time monitoring You can configure expected average response times for network requests and component method invocations. EAServer keeps a running average of the actual response time, and temporarily blocks creation of additional component instances or network connections when the response time rises above the configured maximum. When the average response time drops below the maximum, blocked requests are allowed to continue.
| Copyright © 2005. Sybase Inc. All rights reserved. |

|
|