Once you have located an example that performs some processing you want to learn about, you can run it to examine how it works and look at the code (and copy it if you want to).
To run the highlighted example, double-click it or click Run!. You can get Help on how to use the example and what it does by clicking the Help button on the example’s main window.
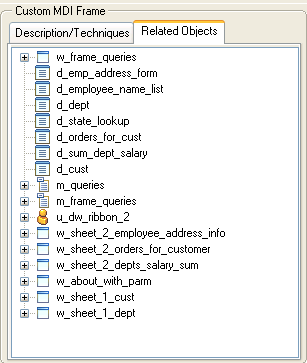
To see all the objects used in an example, click the Related Objects tab on the right pane and click the plus signs to expand items:

Double-click the icon for a script or function to examine it.
Running the Code Examples application and looking at the code for an example gives you a lot of information, but if you open objects in the examples in the development environment, you can examine them in more depth.
For example, you can open any object in a painter, examine the inheritance hierarchy in the Browser, and step through an example in the Debugger. You can even copy objects to your own application in the Library painter or copy code fragments to the Script view.
The libraries in the Code Examples application are organized by object type. For example, pbexamd1.pbl and pbexamd2.pbl contain DataWindow objects. This makes it easy to find the objects that are referenced as examples later in this book. If you expand the sample libraries in the List view in the Library painter, the comments tell you what each object is used for.