Now you open the Debugger and add breakpoints to examine the behavior of the login and Customer windows. When PowerBuilder runs the application in debug mode, it stops just before executing a line containing a breakpoint.
When you insert breakpoints in a script, you should select lines that contain executable statements. If you try to set a breakpoint in variable-declaration lines, comment lines, or blank lines, PowerBuilder sets the breakpoint at the next executable line.

Click the Debug button in the PowerBar.
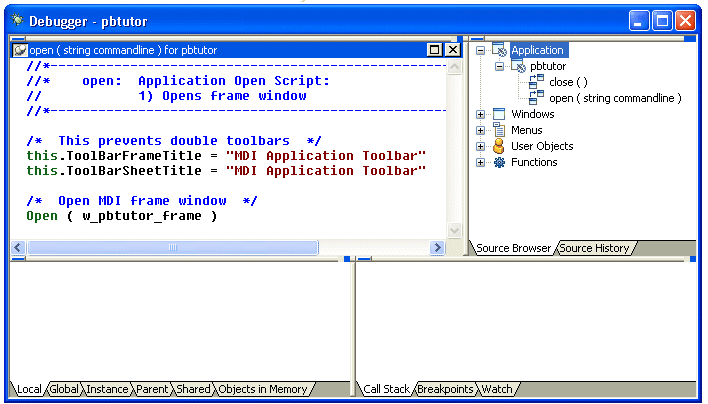
PowerBuilder opens the Debugger. There are three stacks of tabbed panes in the default view layout scheme. The Source view is visible in a single pane at the top left of the Debug window. The Source Browser view is open in the pane at the top right.
![]() If the Debug window looks different
If you have opened the Debug window before and opened, moved,
or closed any views, your display may look different. To restore
the default view layout scheme, select View>Layouts>Default from
the menu bar.
If the Debug window looks different
If you have opened the Debug window before and opened, moved,
or closed any views, your display may look different. To restore
the default view layout scheme, select View>Layouts>Default from
the menu bar.

The source code for the application Open event displays in the Source view at top left. If it does not display, expand the Application node in the Source Browser view’s tree view and double-click the Open event under the pbtutor application.
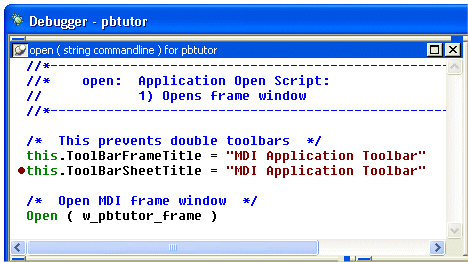
In the Source view, double-click the line containing the following assignment statement:
this.ToolBarSheetTitle = "MDI Application Toolbar"
A black breakpoint symbol displays at the start of the line to show that a breakpoint has been set on the statement.

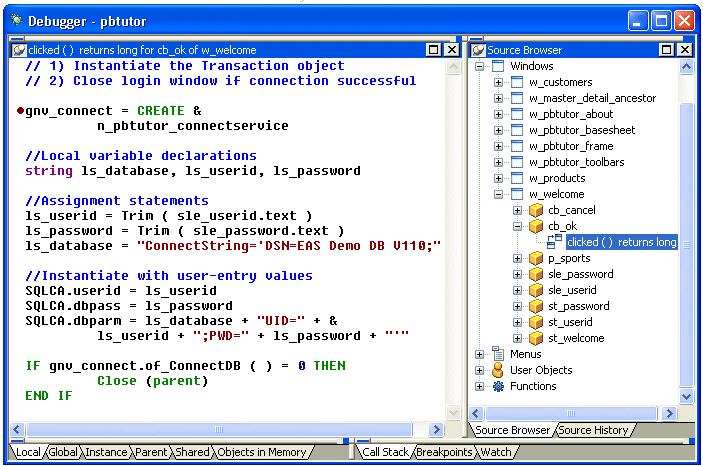
Expand the following node in the Source Browser view: Windows>w_welcome>cb_ok
The Source Browser view lists only events that have been coded. The only event for the login window OK button is the Clicked event.
Double-click the Clicked event for the cb_ok button in the Source Browser view.
The code for the Clicked event displays in the Source view.
Double-click the following line:
gnv_connect = CREATE &
n_pbtutor_connectservice
A breakpoint symbol displays at the start of the line.

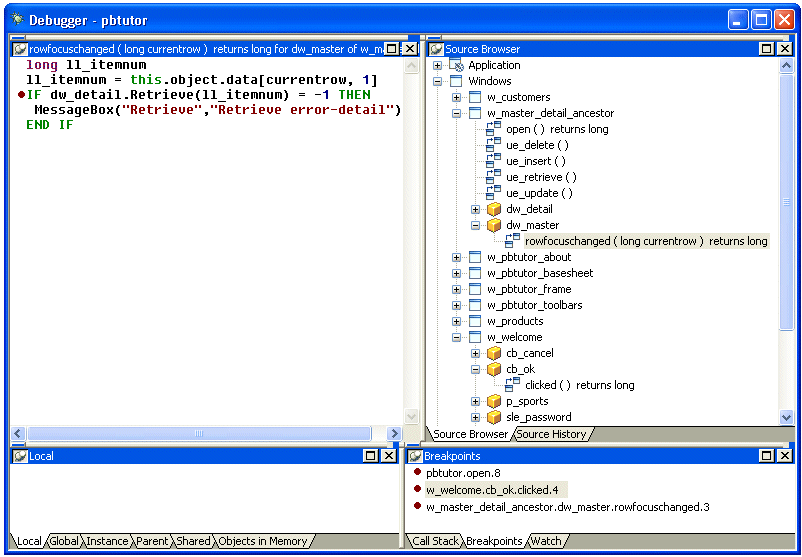
Double-click w_master_detail_ancestor in the Source Browser view.
Double-click dw_master, then rowfocuschanged.
PowerBuilder displays the script for the RowFocusChanged event of the dw_master DataWindow control in the Source view.
Double-click this line:
IF dw_detail.Retrieve(ll_itemnum) = -1 THEN
A breakpoint symbol displays at the start of the line.
Select the Breakpoints tab in the lower-right stack.

You should see the breakpoints you set in the Breakpoints view. To complete this lesson, you need to have these breakpoints set correctly.