The PortfolioValuation diagram uses simple queries to aggregate and join data from two input windows.
The example:
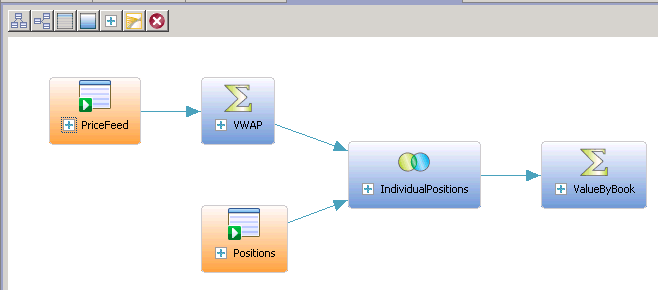
- Reads data from an input window, PriceFeed, with five columns: Id, Symbol, Price, shares, and TradeTime.
- Applies an Aggregate simple query to create a moving average—a volume weighted average price (VWAP). With the VWAP, you can see the value of positions based on the average price, rather than see the value of your positions change with every small price movement.
- Read data from another input window, Positions, with three columns: BookId, Symbol, and SharesHeld.
- Applies a Join simple query, joining the market price (from the VWAP aggregate) to your holdings (Positions), so that you can see the value of your position in each stock.
- Applies one more aggregation to show the total value of each "book." This aggregate, ValueByBook, embodies a strategy where your positions may be organized by different "books," which may be portfolios or funds.
Portfolio Valuation Sample Diagram (Iconic Mode)