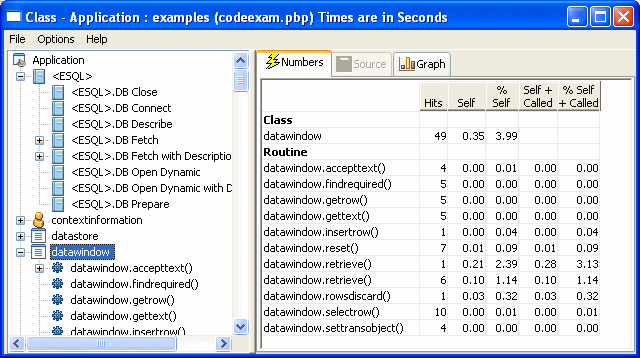
The Class view uses a TreeView control to display statistics for PowerBuilder objects, their functions, and their events. It displays statistics only for those objects that were active while tracing was enabled. The Class view has three tabs:
For each object, the Class view shows all the routines called from each class with the number of times each routine was called (hit) as well as timing information for each call. The following illustration shows part of a Class view. Embedded SQL commands are shown as being called from a pseudo class called ESQL.

The Class view includes both PowerBuilder system-level objects (such as DataWindow and SystemFunction) and user-defined classes (such as windows and user objects). Each top-level node is a PowerBuilder class. As you expand the TreeView control, each node represents a routine and each subnode represents a called routine.
The Class view uses the call graph model to show cumulative statistics for objects, routines, and called routines. The information displayed on the right side of the display differs depending on the current node on the left.
Current node |
Statistics displayed |
|---|---|
Application |
Statistics for each object |
Object |
Cumulative statistics for the object and detailed statistics for the object's routines |
Routine |
Cumulative statistics for the routine and detailed statistics for called routines |
You can sort items on the right by clicking the heading.
The Class view displays five metrics. The profiling tool accesses these metrics from instances of the ProfileCall and ProfileRoutine objects. The time scale you specified in the Preferences dialog box determines how times are displayed.
Metric |
What it means |
|---|---|
Hits |
The number of times a routine executed in a particular context. |
Self |
The time spent in the routine or line itself. If the routine or line was executed more than once, this is the total time spent in the routine or line itself; it does not include time spent in routines called by this routine. |
%Self |
Self as a percentage of the total time the calling routine was active. |
Self+Called |
The time spent in the routine or line and in routines or lines called from the routine or line. If the routine or line was executed more than once, this is the total time spent in the routine or line and in called routines or lines. |
%Self+Called |
Self+Called as a percentage of the total time that tracing was enabled. |
![]() About percentages
The percentages captured in the trace file are based on the
total time tracing was enabled. Because an application can be idle
(while displaying a MessageBox, for example), percentage metrics
are most meaningful when you control tracing programmatically, which
can help to minimize idle time. Percentages are least meaningful
when you create a trace file for a complete application.
About percentages
The percentages captured in the trace file are based on the
total time tracing was enabled. Because an application can be idle
(while displaying a MessageBox, for example), percentage metrics
are most meaningful when you control tracing programmatically, which
can help to minimize idle time. Percentages are least meaningful
when you create a trace file for a complete application.