Statistics information is generated at the thread level when the query is executed in parallel using several worked threads.
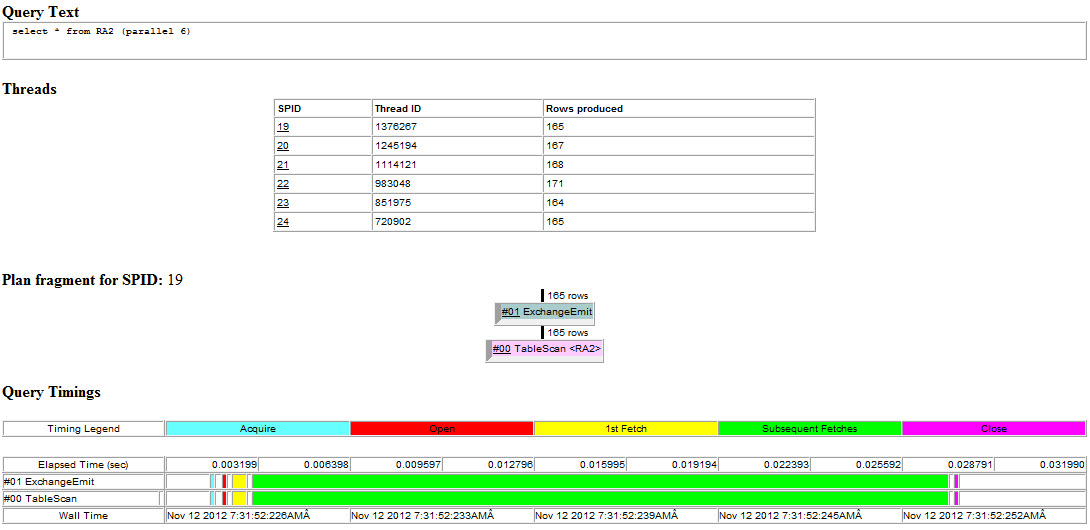
When the query is executed in parallel using several worked threads, several plan fragments (subplans from the main query plan) are created. Those plan fragments are executed in parallel by the threads.
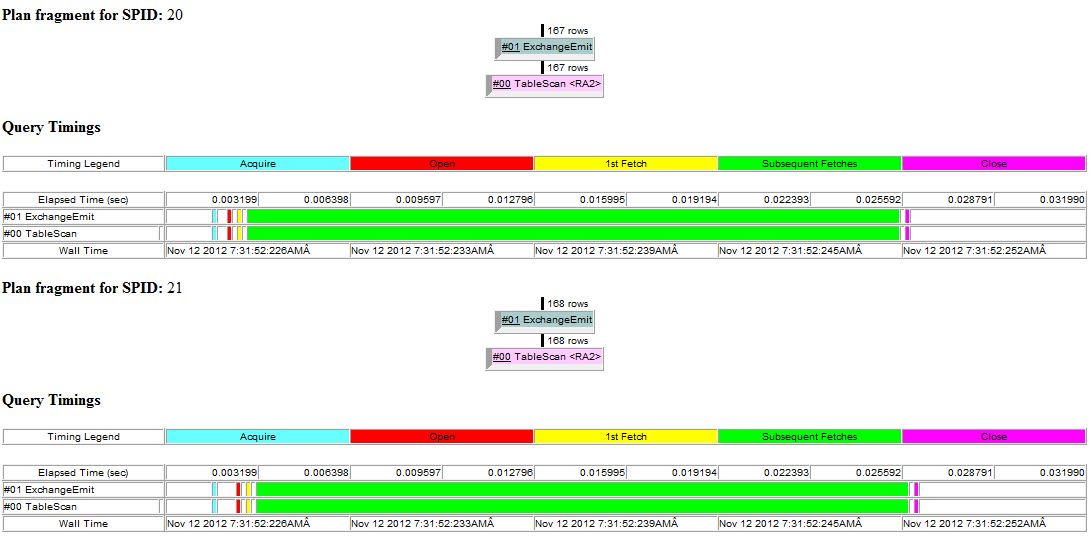
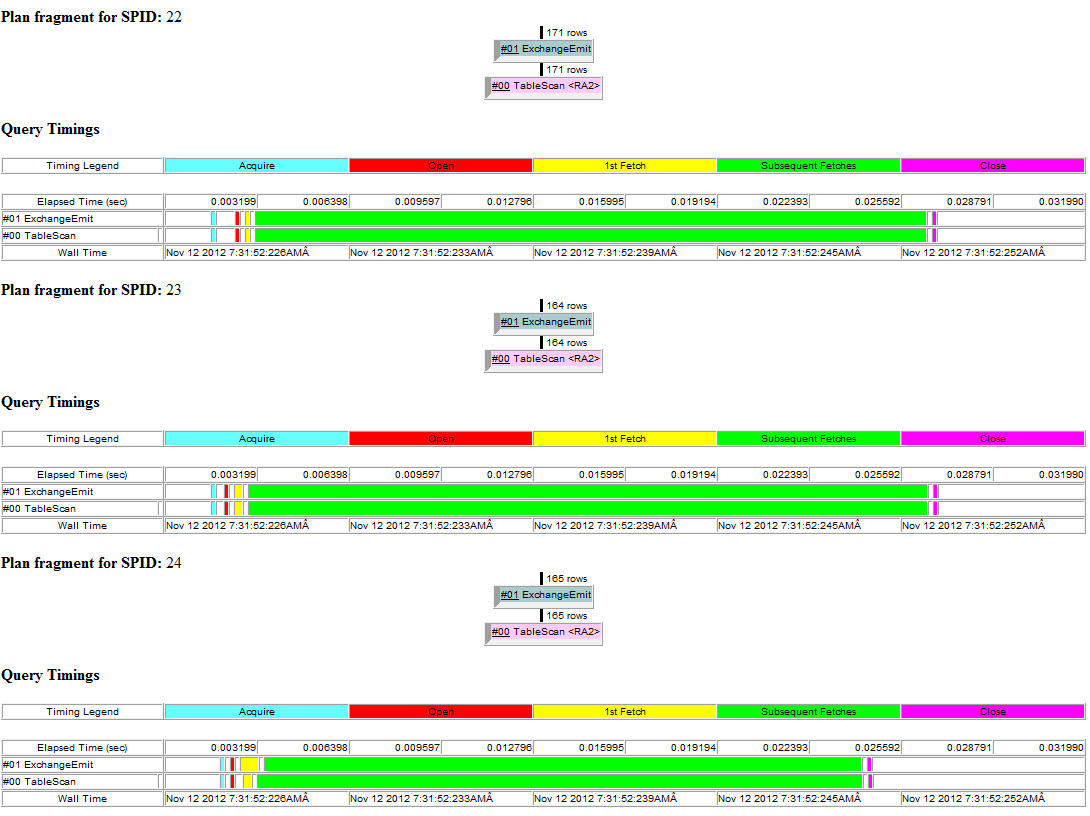
Query tree and elapsed time per operator information is generated as HTML output at the thread level for each plan fragment and thread when set statistics parallel_plan_detail_html is on. The query tree shows only the fragment executed, and the timing diagram shows only the operators executed by that particular thread.
With this approach, you can diagnose the behavior of specific threads and plan fragments in comparison with the global execution of the query. This allows you to analyze the time spent in a particular operator by a specific thread, or the number of rows traversing an operator by thread, and so on.
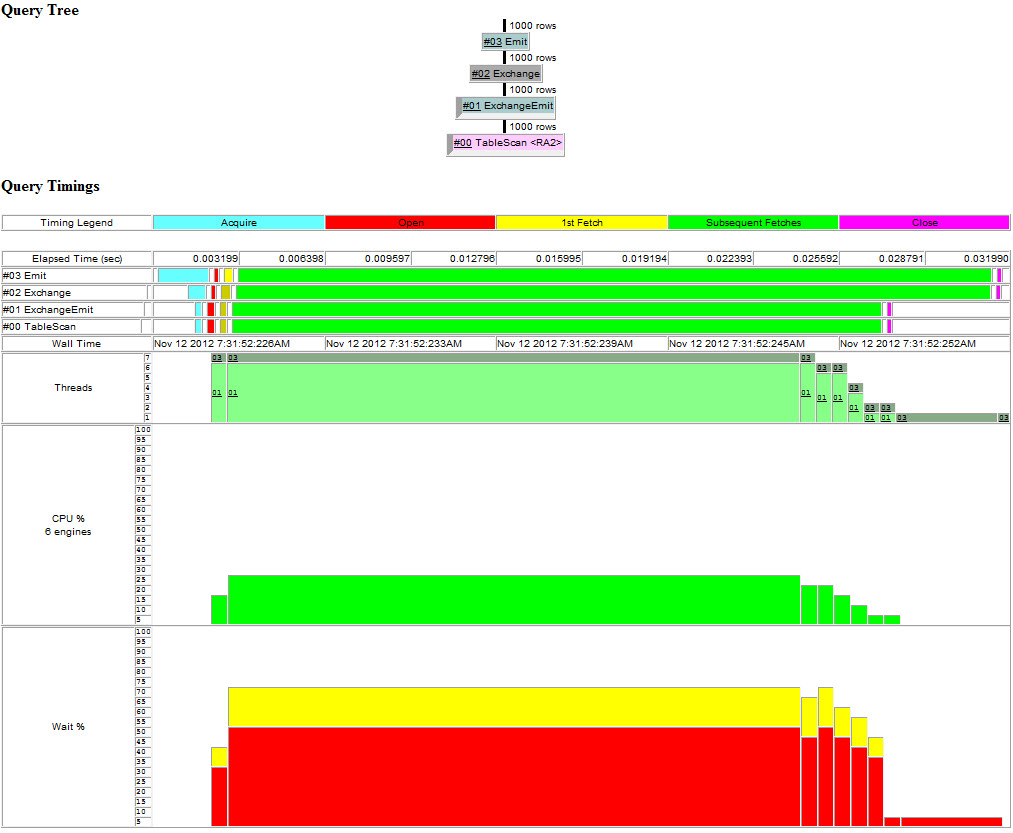
For parallel queries, if you do not use the option set statistics parallel_plan_detail_html, only a single query tree and timing diagram is generated in HTML, representing the summary (in terms of execution time, rows and so on) for all the threads involved in the query.