In Adaptive Server versions 15.7 SP100 and later, you can generate a graphical query plan in HTML format for viewing in a Web browser.
In versions earlier than 15.7 SP100, analysis of complex queries evaluated text-based output provided by the set showplan and set statistics {time | IO} commands.
Use the HTML set statistics commands when a query plan is executed to generate graphical representations of query plan execution statistics. These HTML representations are on a single page, providing a comprehensive tree structure and timing diagram that offers a more intuitive and clearer description of a query plan.
The HTML output includes:
-
The tree representation of the query plan provides information such as:
- Number of row for each query operator and the connection between the parent and child operators.
- Number of threads per operator if they query was executed in parallel by several threads.
-
The full text of the query.
-
Optionally, a timing diagram can be generated, which includes information such as:
- A timing legend indicating the time spent in the different query execution phases, such as acquire, open, first fetch, subsequent fetches, and close.
- Elapsed time for each operator and the execution phases for each query.
-
For queries using parallelism, a thread-distribution diagram can be generated, which indicates the usage of threads along the query execution.
-
A resource usage diagram can be generated, which displays CPU usage and wait-time distribution. CPU usage and Wait distribution is generated only for queries executed in parallel.
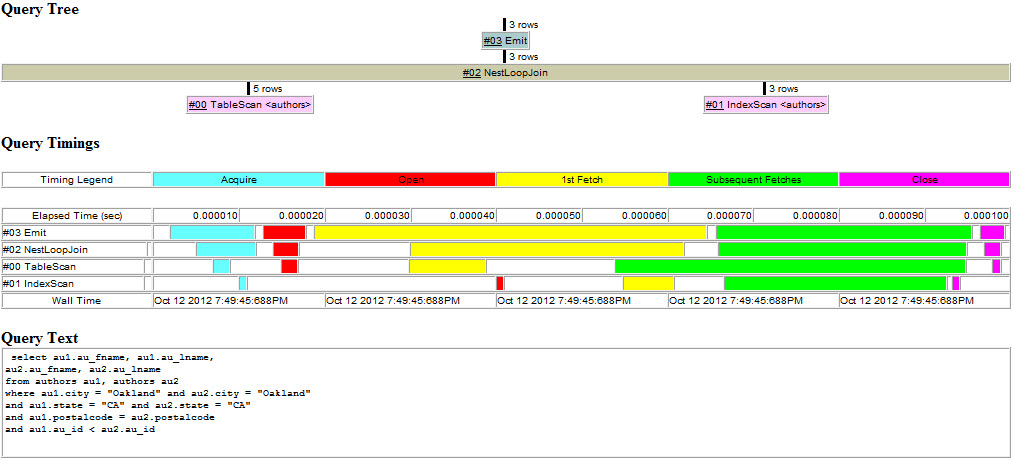
The following is an example of the HTML output, which includes a timing diagram.