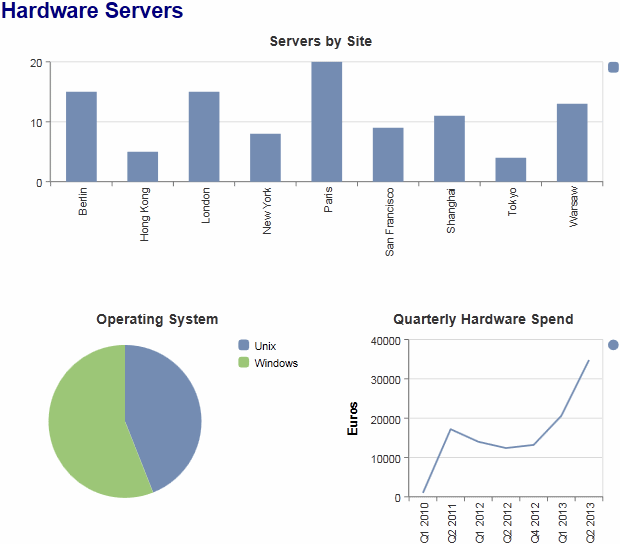
In this example, we will create three charts to visualize information
about a set of hardware servers modeled in an enterprise architecture model. We will analyze
the distribution of servers by geographic site, the operating system split, and the
quarterly spend on servers (using extended attributes).
Before creating the report, the EAM model was created and populated with hardware
servers assigned to various sites, and two new properties were added to the Hardware
Server property sheet (see
Adding New Properties to an Object) as extended
attributes:
| Name |
Data Type |
|---|
| Purchase Date |
Date |
| Purchase Cost |
Integer |
- Create a report, expand the General Components category in the report Toolbox,
and double-click the Title tool to add a title. Click the default title text and
enter Hardware Servers.
- Click the Chart tool and drag and drop it onto the center of the guide arrows
on the title item to create a chart in the Hardware Servers item:
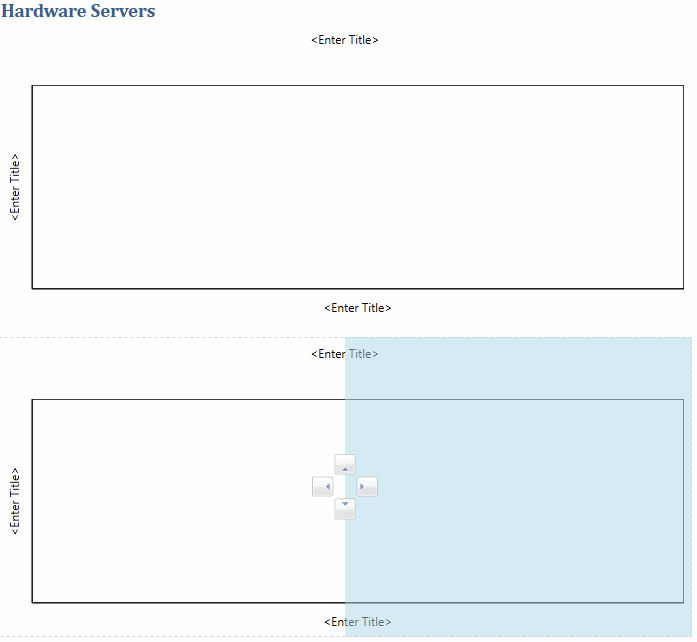
- Drag the Chart tool again and drop it onto the bottom guide arrow on the first
chart item to create a new chart underneath it. Then drag the Chart tool a third
time and drop it on the right guide arrow on the second chart to create a new
chart next to it:
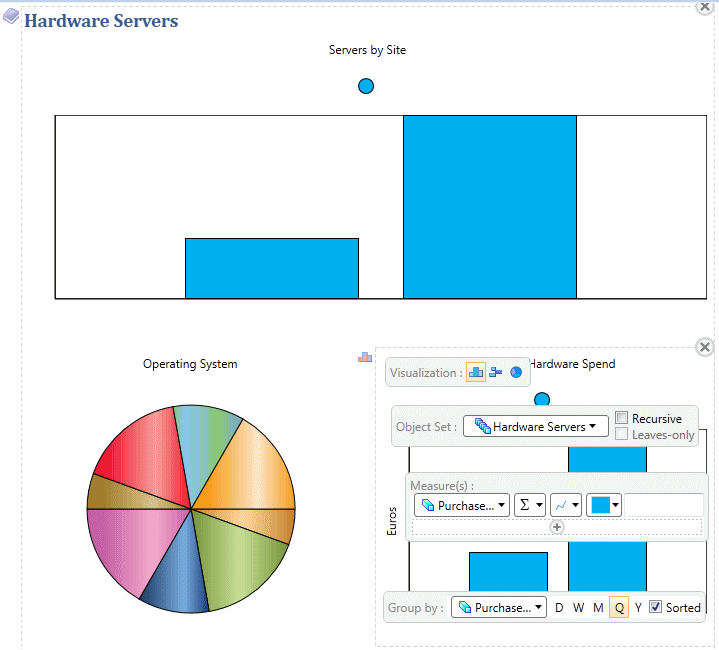
- Enter the following chart parameters:
| Parameter |
First Chart |
Second Chart |
Third Chart |
|---|
| Visualization |
Column |
Pie |
Column |
| Object Set |
Hardware Servers |
Hardware Servers |
Hardware Servers |
| Group by |
Site |
Operating System |
Purchase Date/ ([Q]uarter) |
| Measure |
[None]/Count/Bar |
[None]/Count |
Purchase Cost/Sum/Line |
| Top Title |
Servers by Site |
Operating System |
Quarterly Hardware Spend |
| Left Title |
[Space] |
N/A |
Euros |
| Bottom Title |
[Space] |
N/A |
[Space] |
Note: The representation of the chart in the Design view does not change as you
complete the parameters. You can, at any time, click the background of a
chart and then click the Quick View tool to preview
it with the data from your model.

- Click the Generate Web Report (HTML) tool in the report
tool bar and select to open it in your browser:


