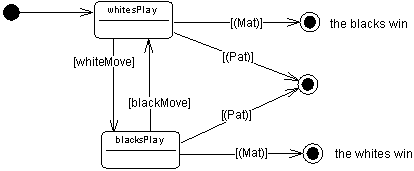
A statechart diagram is a UML diagram that provides a graphical view of a State Machine, the public behavior of a classifier (component or class), in the form of the changes over time of the state of the classifier and of the events that permit the transition from one state to another.
It is assumed that the classifier has previously been identified in another diagram and that a finite number of states can be identified for it.
Unlike the interaction diagrams, the statechart diagram can represent a complete specification of the possible scenarios pertaining to the classifier. At any given moment, the object must be in one of the defined states.
You can create several statechart diagrams for the same classifier, but then the states and transitions represented should relate to a different aspect of its evolution. For example; a person can be considered on one hand as moving between the states of studying, working, being unemployed, and being retired, and on the other as transitioning between being single, engaged, married, and divorced.
Statechart diagrams show classifier behavior through execution rules explaining precisely how actions are executed during transitions between different states; these states correspond to different situations during the life of the classifier.

The example above shows the states of a game of chess.
The first step in creating a statechart diagram consists in defining the initial and final states and the set of possible states between them. Then you link the states together with transitions, noting on each, the event that sets off the transition from one state to another.
You can also define an action that executes at the moment of the transition. Similarly, the entry to or exit from a state can cause the execution of an action. It is even possible to define the internal events that do not change the state. Actions can be associated with the operations of the classifier described by the diagram.
It is also possible to decompose complex states into sub-states, which are represented in sub-statechart diagrams.
A statechart diagram requires the previous identification of a classifier. It can be used to describe the behavior of the classifier, and also helps you to discover its operations via the specification of actions associated with statechart events.
You can also use the transitions identified to establish the order in which operations can be invoked. This type of diagram is called a "protocol state machine".
Another potential use is the specification of a Graphic User Interface (GUI) where the states are the distinct screens available with possible transitions between them, all depending on keyboard and mouse events produced by the user.