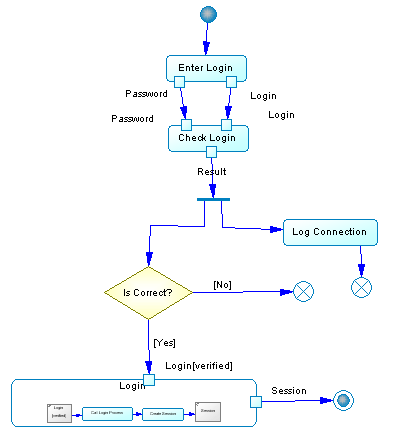
An activity diagram is a UML diagram that provides a graphical view of a system behavior, and helps you functionally decompose it in order to analyze how it will be implemented.
Whereas a statechart diagram focuses on the implementation of operations in which most of the events correspond precisely to the end of the preceding activity, the activity diagram does not differentiate the states, the activities and the events.
The activity diagram gives a simplified representation of a process, showing control flows (called transitions) between actions performed in the system (called activities). These flows represent the internal behavior of a model element (use case, package, classifier or operation) from a start point to several potential end points.

You can create several activity diagrams in a package or a model. Each of those diagrams is independent and defines an isolated context in which the integrity of elements can be checked.
Analyzing a Use Case
An activity diagram is frequently used to graphically describe a use case. Each activity corresponds to an action step and the extension points can be represented as conditional branches.
Analyzing a Business Process
Beyond object-oriented modeling, activity diagrams are increasingly used to model the business processes of an enterprise. This kind of modeling takes place before the classic UML modeling of an application, and permits the identification of the important processes of the enterprise and the domains of responsibility of each organizational unit within the enterprise.
For more information about business process modeling with PowerDesigner, see Business Process Modeling.