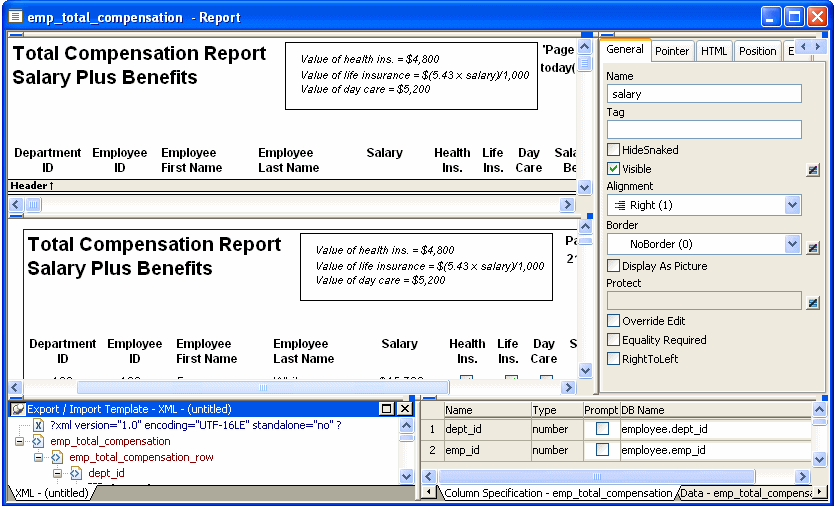
The Report painter provides views related to the report you are working on. Interacting with these views is how you work in the Report painter.
The following picture shows a report in the Report painter with the default layout.

The Design view at the top left shows a representation of the report and its controls. You use this view to design the layout and appearance of the report. Changes you make are immediately shown in the Preview view and the Properties view.
The Preview view in the middle on the left shows the report with data as it will appear at runtime. If the Print Preview toggle (File>Print Preview) is selected, you see the report as it would appear when printed with an optional blue outline that shows where the page margins are located.
The Export/Import Template view for XML at the bottom left shows a default template for exporting and importing data in XML format. You can define custom templates for import and export. The templates are saved with the report. For more information, see Chapter 12, “Exporting and Importing XML Data.”
The Export/Import Template view for XHTML is designed for use with the Web DataWindow feature in PowerBuilder. This view, and the Web Generation and JavaScript Generation tab pages in the Properties view, are not used in InfoMaker.
The Properties view at the top right displays the properties for the currently selected control(s) in the report, for the currently selected band in the report, or for the report itself. You can view and change the values of properties in this view.
The Control List in the stacked pane at the bottom right view lists all controls in the report. Selecting controls in this view selects them in the Design view and the Properties view. You can also sort controls by Control Name, Type, or Tag.
The Data view in the stacked pane at the bottom right displays the data that can be used to populate a report and allows manipulation of that data.
The Column Specifications view in the stacked pane at the bottom right shows a list of the columns in the data source. For the columns, you can add, modify, and delete initial values, validation expressions, and validation messages. You can also specify that you want a column to be included in a prompt for retrieval criteria during data retrieval. To add a column to the report, you can drag and drop the column from the Column Specifications view to the Design view. For external or stored procedure data sources, you can add, delete, and edit columns (column name, type, and length).