You can group related rows together and, optionally, calculate statistics for each group separately. For example, you might want to group employee information by department and get total salaries for each department.
Each group is defined by one or more report columns. Each time the value in a grouping column changes, a break occurs and a new section begins.
For each group, you can:
Display the rows in each section
Specify the information you want to display at the beginning and end of each section
Specify page breaks after each break in the data
Reset the page number after each break
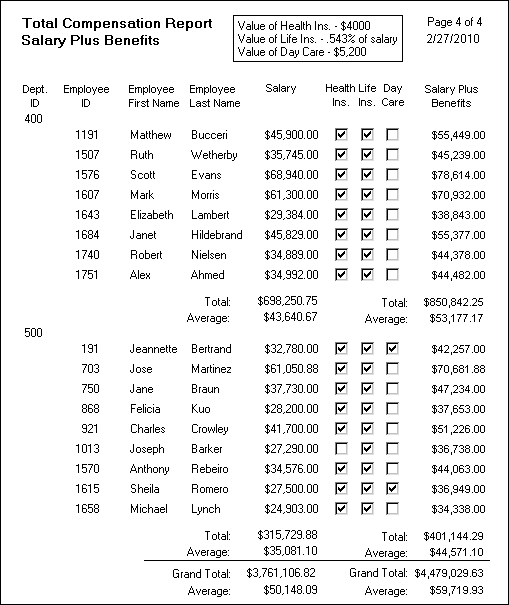
The following report retrieves employee information. It has one group defined, Dept_ID, so it groups rows into sections according to the value in the Dept_ID column. In addition, it displays:
Department ID before the first row for that department
Totals and averages for salary and salary plus benefits (a computed column) for each department
Grand totals for the company at the end
The following screenshot shows the report.

You can create a grouped report in three ways:
Use the Group presentation style to create a grouped report from scratch (“Using the Group presentation style”).
Take an existing tabular report and define grouping (“Defining groups in an existing report”).
Use the TreeView presentation style (Chapter 15, “Working with TreeViews”).