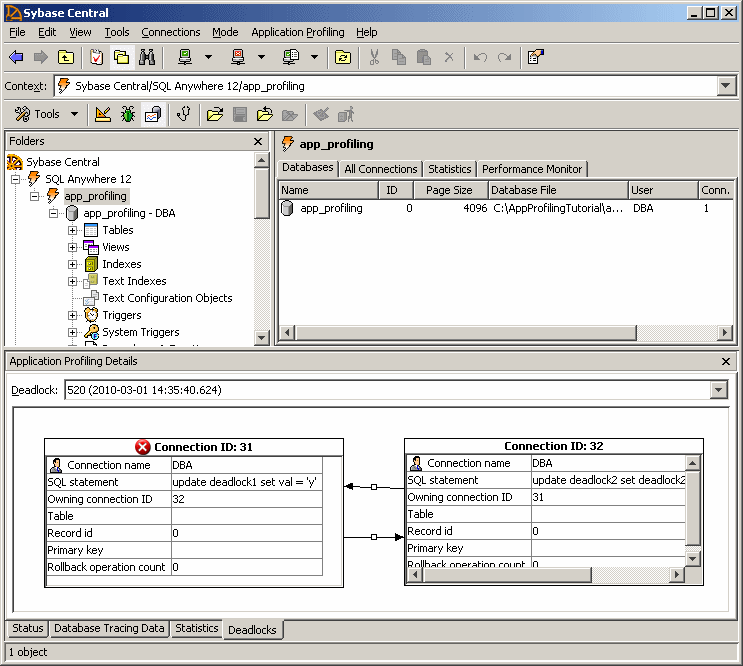
The Application Profiling mode provides a graphical representation of the connections participating in the deadlock. It also provides a Connection Blocks tab that provides additional information about the blocked connections.
 Review blocked connection data
Open the analysis file created during the tracing session as follows:
In Sybase Central, click Application Profiling » Open Analysis File Or Connect To A Tracing Database.
Click In A Tracing Database.
Click Open.
In the User ID field, type DBA.
In the Password field, type sql.
In the Action dropdown list, click Connect To A Running Database On This Computer.
In the Database Name field, type app_profiling.
Click Connect.
View the graphical representation of the deadlock as follows:
In the Application Profiling Details pane click the Status tab and choose the most recent ID from the Logging Session ID list.
If the Application Profiling Details pane does not appear, click View » Application Profiling Details.
At the bottom of the Application Profiling Details pane, click the Deadlocks tab. The most recent deadlock appears. Click the Deadlock list to view additional deadlocks.
The following image shows how the UPDATE statements created a deadlock condition.

Each connection involved in the deadlock is represented by a table with the following fields:
Connection Name This field shows the user ID that opened the connection.
SQL Statement This field shows the actual statement involved in the deadlock. In this case, the deadlock was caused by the UPDATE statements found in the procedures you executed from each instance of Interactive SQL.
Owning Connection ID This field shows the ID of the connection that blocked the current connection.
Record ID This field shows the ID of the row that the current connection is blocked on.
Rollback Operation Count This field shows the number of operations that must be rolled back as a result of the deadlock. In this case, the procedures contained only the UPDATE statements, so the count is 0.
To view additional deadlock information, such as how often they occur and how long they last, use the Connection Blocks tab, as follows:
In the Application Profiling Details pane, click the Database Tracing Data tab.
Click the Connection Blocks tab, just above the Database Tracing Data tab.
The Connection Blocks tab appears, displaying the block time, unblock time, and duration of each blocked connection.
You have completed the application profiling tutorial on deadlocks. Click Connections » Disconnect, and then close Sybase Central.
 See also
 |
Discuss this page in DocCommentXchange.
|
Copyright © 2012, iAnywhere Solutions, Inc. - SQL Anywhere 12.0.1 |