To view detailed node information in the graphical plan, in the left pane click the node in the graphical diagram. Details about the node appear on the right in the Details and Advanced Details panes. In the Details pane, statistics for the node may appear in three main sections:
Node statistics are statistics related to the execution of the specific node. Plan nodes have a Details pane that displays estimated, actual, and average statistics for the operator. Any node can be executed multiple times. For example when a leaf node appears on the right side of a nested loops join node, you can fetch rows from the leaf node operator multiple times. In this case, the Details pane of the leaf node (a sequential, index, or RowID scan node) contains both per-invocation (average) and cumulative actual run-time statistics.
When a node is not a leaf node it consumes intermediate results from other nodes and the Details pane displays the estimated and actual cumulative statistics for this node's entire subtree in the Subtree Statistics section. Optimizer statistic information representing the entire SQL request is present only for root nodes. Optimizer statistic values are related specifically to the optimization of the statement, and include values such as the optimization goal setting, the optimization level setting, the number of plans considered, and so on.
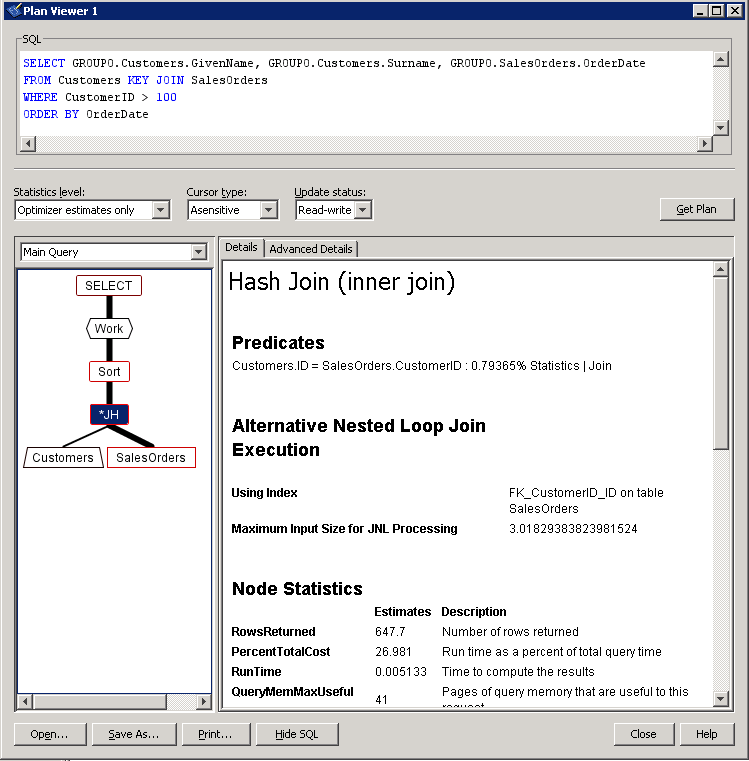
Consider the following query, which orders the customers by their order date:
SELECT GROUPO.Customers.GivenName, GROUPO.Customers.Surname, GROUPO.SalesOrders.OrderDate FROM Customers KEY JOIN SalesOrders WHERE CustomerID > 100 ORDER BY OrderDate |
In the graphical plan for this query, the Hash Join (JH) node is elected and the information displayed in the right pane pertains only to that node. The Predicates description indicates that Customers.ID = SalesOrders.CustomerID : 0.79365% Statistics | Join is the predicate applied at the Hash Join node. If you click the Customers node, the Scan Predicates indicates that Customers.ID > 100 : 100% Index; is the predicate applied at the Customers node.

If you run the query in the example below, you may get a different plan in the Plan Viewer than the one shown. Many factors such as database settings and recent queries can impact the optimizer's choice of plan.
The information displayed in the Advanced Details pane is dependent on the specific operator. For root nodes, the Advanced Details pane contains the settings that were in effect for the connection options when the query was optimized. With other node types, the Advanced Details pane might contain information about which indexes or materialized views were considered for the processing of the particular node.
To obtain context-sensitive help for each node in the graphical plan, right-click the node and click Help.
If a query is recognized as a bypass query, some optimization steps are bypassed and neither the Query Optimizer section nor the Predicate section appear in the graphical plan.
 See also
 |
Discuss this page in DocCommentXchange.
|
Copyright © 2012, iAnywhere Solutions, Inc. - SQL Anywhere 12.0.1 |