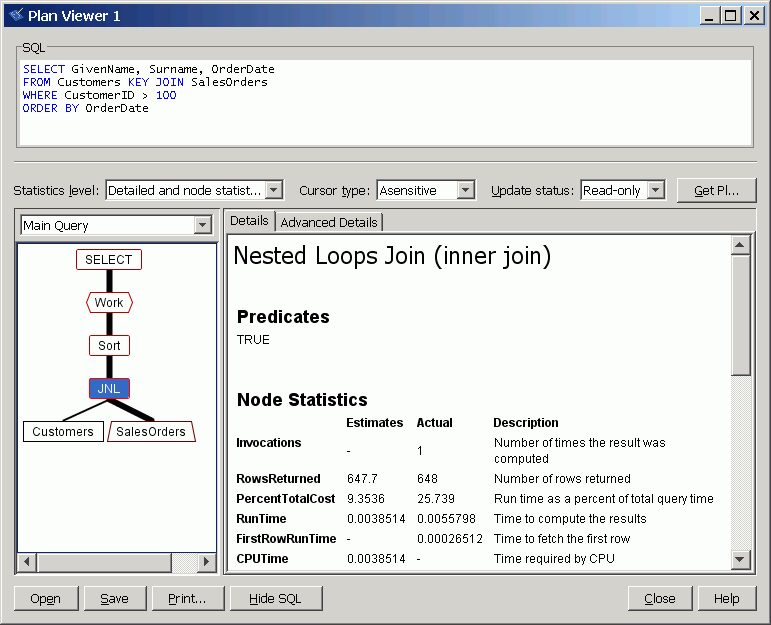
To view detailed node information in the graphical plan, in the left pane click the node in the graphical diagram. Details about the node appear on the right in the Details and Advanced Details panes. In the Details pane, statistics for the node appear in three sections:
Node statistics are statistics related to the execution of the specific node. Leaf nodes have a Details pane that displays estimated and actual statistics for the operator. When a leaf node appears on the right side of a parent node, you can fetch rows from the parent operator multiple times. For example, with a nested loop join the leaf node (a sequential, index, or RowID scan node) contains both per-invocation (average) and cumulative actual run-time statistics.
When a node is not a leaf node it consumes intermediate result(s) from other nodes and the Details pane displays the estimated and actual cumulative statistics for this node's entire subtree in the Subtree Statistics section. Optimizer statistic information representing the entire SQL request is present only for root nodes. Optimizer statistics values are related specifically to the optimization of the statement, and include values such as the optimization goal setting, the optimization level setting, the number of plans considered, and so on.
In the example shown below, the nested loops join (JNL) node is selected and the information displayed in the right pane pertains only to that node. For example, the Predicates description is TRUE, indicating that a predicate is not applied. If you click the Customers node, the Predicate value changes to Customers.ID > 100 : 100% Index; true 126/126 100%.

The information displayed in the Advanced Details pane is dependent on the specific operator. For root nodes, the Advanced Details pane contains the setting of all connection options in effect when the query was optimized. With other node types, the Advanced Details pane might contain information about which indexes or materialized views were considered for the processing of the particular node.
To obtain context-sensitive help for each node in the graphical plan, right-click the node and choose Help.
For more information about the abbreviations used in the plan, see Execution plan abbreviations.
If a query is recognized as a bypass query, some optimization steps are bypassed and neither the Query Optimizer section nor the Predicate section appear in the graphical plan. For more information about bypassed queries, see How the optimizer works.
 See also
 |
Discuss this page in DocCommentXchange.
|
Copyright © 2010, iAnywhere Solutions, Inc. - SQL Anywhere 12.0.0 |