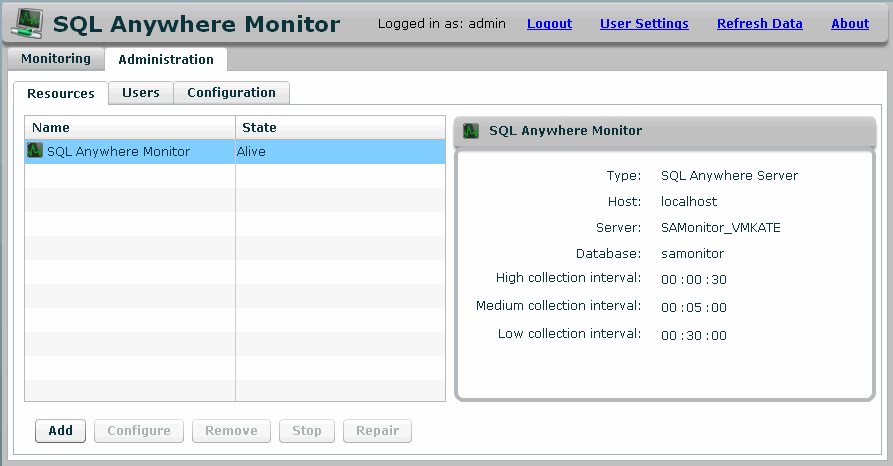
In the Monitor, the Monitoring tab provides an overview of the health and availability of the MobiLink servers being monitored.
The top pane contains a table that lists the resources that are being monitored. A resource is a MobiLink server. This table also indicates whether the resources are currently running and whether they require a user to perform any actions on them. See Interpreting resource states and status.
The bottom pane of the Monitoring tab contains the alerts and a variety of current metrics for the selected MobiLink server. Most of these tabs contain links to graphs. You can change the range of the graphs with the dropdown list and arrows at the top right of each graph.
The Administration tab is reserved for administrators. On it, you can select the MobiLink servers that you want to monitor, add and edit users, and configure the Monitor.

Interpreting resource states and status
Monitor metrics
Metric tab descriptions
Delete old Monitor metrics
| Discuss this page in DocCommentXchange. Send feedback about this page using email. |
Copyright © 2009, iAnywhere Solutions, Inc. - SQL Anywhere 11.0.1 |