Use this tutorial to learn how to use the Database Tracing Wizard to view deadlocks that might occur in your database. You can use the Database Tracing Wizard to examine the conditions under which the deadlocks are occurring, and the connections that are causing them.
This tutorial assumes you have followed the setup steps for the application profiling tutorials. If you have not, see Setting up for the application profiling tutorials.
Deadlocks occur when two or more transactions block one another. For example, Transaction A requires access to Table B, but Table B is locked by Transaction B. Transaction B requires access to Table A, but Table A is locked by Transaction A. A cyclical blocking conflict occurs.
A good indication that deadlocks are occurring is when SQLCODE -306 and -307 are returned. To resolve a deadlock, SQL Anywhere automatically rolls back the last statement that created the deadlock. Performance problems occur if statements are constantly rolled back.
You can copy and paste the SQL statements in this tutorial into Interactive SQL.
To create a deadlock
Start Sybase Central and connect to the test database app_profiling.db with the user ID DBA and the password sql.
If you have not created the test database, see Setting up for the application profiling tutorials.
If you are unfamiliar with starting Sybase Central and connecting to a database, see Connecting to a database on your own computer from Sybase Central or Interactive SQL.
In the left pane, click app_profiling - DBA, and then choose File » Open Interactive SQL.
Interactive SQL starts and connects to the app_profiling.db database.
In Interactive SQL, run the following SQL statements:
CREATE TABLE "DBA"."deadlock1" ( "id" UNSIGNED BIGINT NOT NULL DEFAULT AUTOINCREMENT, "val" CHAR(1) ); CREATE TABLE "DBA"."deadlock2" ( "id" UNSIGNED BIGINT NOT NULL DEFAULT AUTOINCREMENT, "val" CHAR(1) ); |
INSERT INTO "deadlock1"("val") VALUES('x');
INSERT INTO "deadlock2"("val") VALUES('x'); |
CREATE PROCEDURE "DBA"."proc_deadlock1"(  )
   BEGIN
      LOCK TABLE "DBA"."deadlock1" IN EXCLUSIVE MODE;
      WAITFOR DELAY '00:00:20:000';
      UPDATE deadlock2 SET val='y';
   END;
CREATE PROCEDURE "DBA"."proc_deadlock2"(  )
   BEGIN
      LOCK TABLE "DBA"."deadlock2" IN EXCLUSIVE MODE;
      WAITFOR DELAY '00:00:20:000';
      UPDATE deadlock1 SET val='y';
END; |
COMMIT; |
Exit Interactive SQL.
The Database Tracing Wizard can be used to create a diagnostic tracing session. The tracing session captures deadlock data.
To use the Database Tracing Wizard to create a diagnostic tracing session
In Sybase Central, choose Mode » Application Profiling.
If the Application Profiling Wizard appears, click Cancel.
Start the Database Tracing Wizard.
The Database Tracing Wizard appears.
Create the deadlock.
Interactive SQL starts and connects to the app_profiling - DBA database.
CALL "DBA"."proc_deadlock1"(); |
CALL "DBA"."proc_deadlock2"(); |
After a few moments, the ISQL Error window appears indicating that a deadlock has been detected. This is because proc_deadlock1 requires access to the deadlock2 table, which is locked by proc_deadlock2. And proc_deadlock2 requires access to the deadlock1 table, which is locked by proc_deadlock1.
Close both Interactive SQL windows.
To stop the tracing session, in Sybase Central select the app_profiling - DBA database and choose File » Tracing » Stop Tracing With Save.
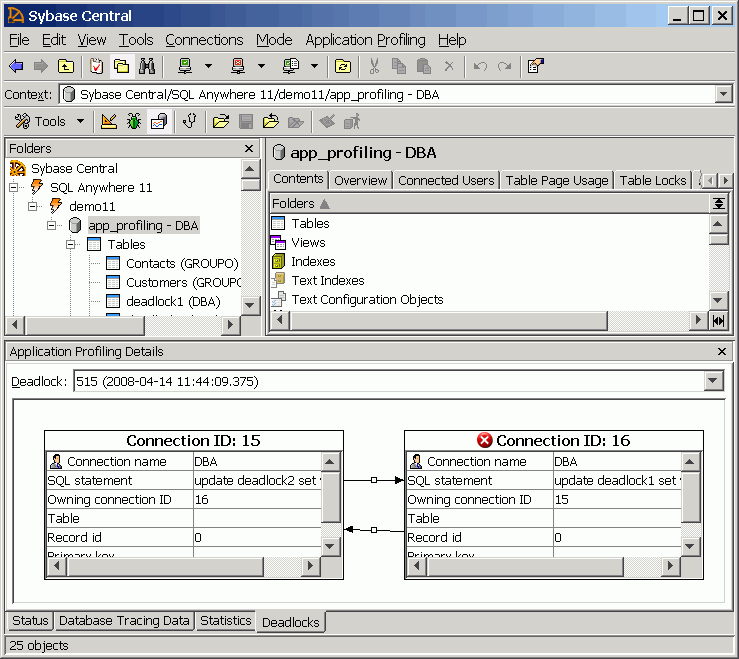
The Application Profiling mode provides a graphical representation of the connections participating in the deadlock. It also provides a Connection Blocks tab that provides additional information on the blocked connections.
To view a graphical representation of the deadlock
Open the analysis file created during the tracing session.
The Open Analysis Or Connect To Tracing Database window appears.
View the graphical representation of the deadlock.
If the Application Profiling Details pane does not appear, choose View » Application Profiling Details.
The following image shows how the UPDATE statements created a deadlock condition.

Each connection involved in the deadlock is represented by a table with the following fields:
Connection Name This field shows the user ID that opened the connection.
SQL Statement This field shows the actual statement involved in the deadlock. In this case, the deadlock was caused by the UPDATE statements found in the procedures you executed from each instance of Interactive SQL.
Owning Connection ID This field shows the ID of the connection that blocked the current connection.
Record ID This field shows the ID of the row that the current connection is blocked on.
Rollback Operation Count This field shows the number of operations that must be rolled back as a result of the deadlock. In this case, the procedures contained only the UPDATE statements, so the count is 0.
You may want to view more deadlock data, such as how often they occur, and how long they last. Use the Connection Blocks tab to view a list of all deadlocks recorded during the database tracing session.
To view deadlock data
In the Application Profiling Details pane, click the Database Tracing Data tab.
Click the Connection Blocks tab, just above the Database Tracing Data tab.
The Connection Blocks tab appears, displaying block time, unblock time, and duration of each blocked connection.
| Send feedback about this page via email or DocCommentXchange | Copyright © 2008, iAnywhere Solutions, Inc. - SQL Anywhere 11.0.0 |