| Copyright © 2007. Sybase Inc. All rights reserved. |
|
|
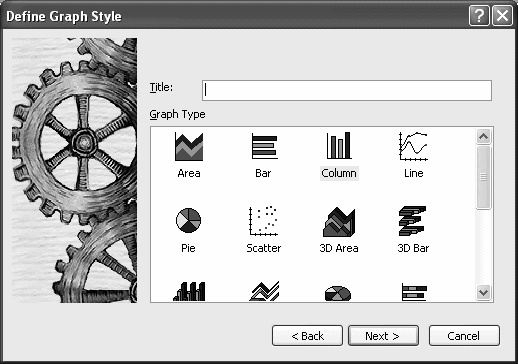
Sybase WorkSpace provides many types of graphs for you to choose from. You choose the type on the Define Graph Style page in the DataWindow wizard or in the General page in the Properties view for the graph.
| Copyright © 2007. Sybase Inc. All rights reserved. |
|
|