| Copyright © 2007. Sybase Inc. All rights reserved. |

|
|
In addition to the (preceding) text-based presentation styles, Sybase WorkSpace provides two styles that allow you to display information graphically: Graph and Crosstab.
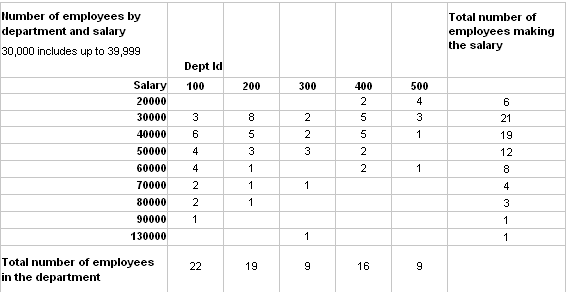
There is a graph report in the composite report in “Using the Composite style”. This crosstab report counts the number of employees that fit into each cell. For example, there are three employees in department 100 who make between $30,000 and $39,999:
