Using the Tabular style

The Tabular presentation style presents data with the data columns going across the page and headers above each column. As many rows from the database will display at one time as can fit in the DataWindow object. You can reorganize the default layout any way you want by moving columns and text:
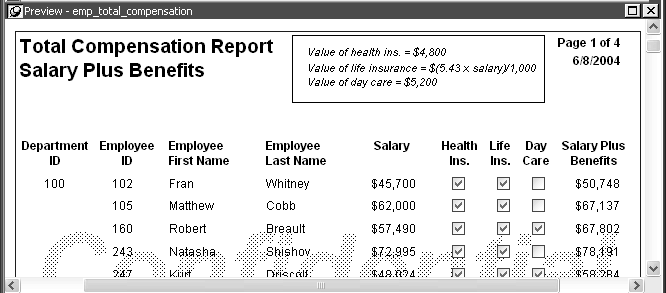
The sample for Tabular presentation style is titled Total Compensation Report Salary Plus Benefits. It presents data in nine columns across the page. The headers above the columns from left to right are Department I D, Employee I D, Employee First Name, Employee Last Name, Salary, Health Ins., Life Ins. Day Care, and Salary Plus Benefits. The screen displays three rows of data for three employees in department one hundred followed by a row of totals and a row of averages, then one row of data for a single employee in department two hundred, and one row of totals and one row of averages. This data fills the number of rows that will fit in the DataWindow object at one time.

Related Tasks