Reports

In InfoMaker, you use the Report painter to create sophisticated reports of data. You can easily group and summarize data. You can view reports on the screen or print them. You cannot change data in a report. To change data, you use the Database painter or the Form painter.

Types of reports

InfoMaker provides a variety of report styles:

Composite

Grid

OLE 2.0

Crosstab

Group

RichText

Freeform

Label

Tabular

Graph

N-Up

TreeView

Here are a few sample reports:

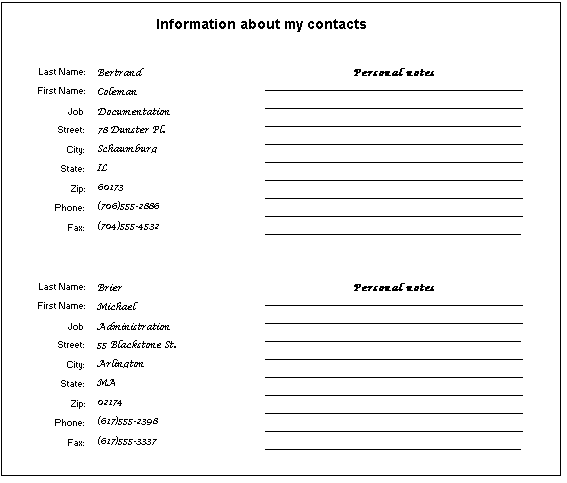
Freeform report

This sample report is labeled Information about my contacts. It displays data for a series of employees at left. For each, several lines of information are listed such as the employee’s name, job, address, and so on. To the right of each employee listing is an area of blank lines titled Personal notes.

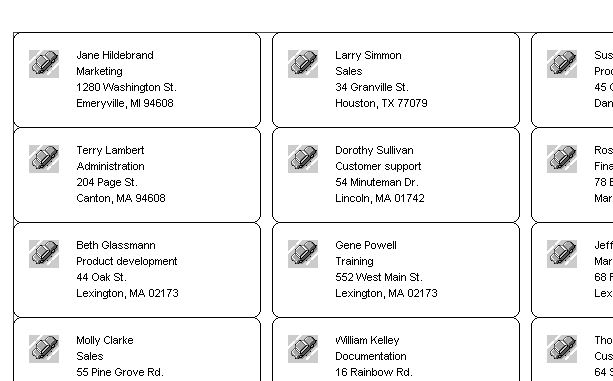
Label report

This sample report shows a portion of a sheet of mailing labels laid out in columns and rows, each with a name and address and a decorative image of a car on the left side of the label.

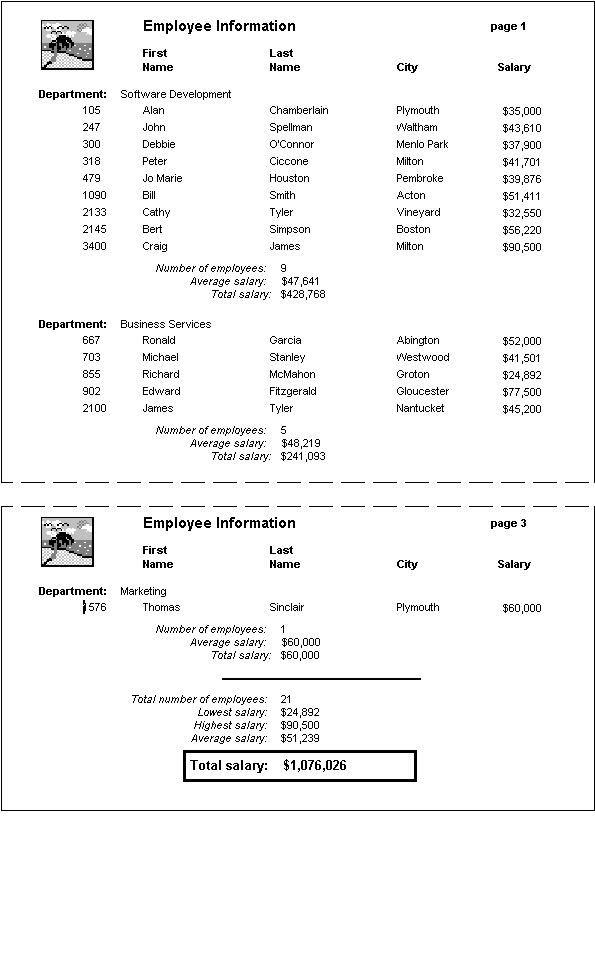
Group report

This sample report titled Employee Information has column heading for First and Last Name, City, and Salary. Under the headings, the data is grouped by Department names. Totals display at the bottom of each department  section for Number of employees, average salary and Total salary. The last page of the report displays grand totals for this data for all departments listed.

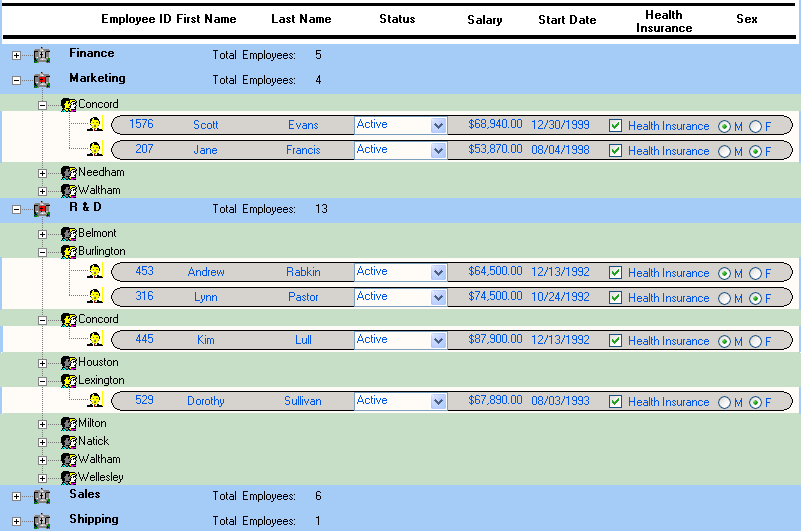
TreeView report

The TreeView report shows a tree view with departments, such as Finance and Marketing at the top level. Some departments are expanded to show a location at the next level and details for individual employees at that location.