Calculates the average of the values returned by an expression in the values list of the crosstab. When the crosstab definition has more than one column, CrosstabAvg can also calculate averages of the expression’s values for groups of column values.
CrosstabAvg ( n {, column, groupvalue } )
Argument |
Description |
|---|---|
n |
The number of the crosstab-values expression for which you want the average of the returned values. The crosstab expression must be numeric. |
column (optional) |
The number of the crosstab column as it is listed in the Columns box of the Crosstab Definition dialog box for which you want intermediate calculations. |
groupvalue (optional) |
A string whose value controls the grouping for the calculation. Groupvalue is usually a value from another column in the crosstab. To specify the current column value in a dynamic crosstab, rather than a specific value, specify @ plus the column name as a quoted string. |
Double. Returns the average of the crosstab values returned by expression n for all the column values or, optionally, for a subset of column values. To return a decimal datatype, use CrosstabAvgDec.
This function is meaningful only for the average of the values of the expression in a row in the crosstab. This means you can use it only in the detail band, not in a header, trailer, or summary band.
Null values are ignored and are not included in the average.
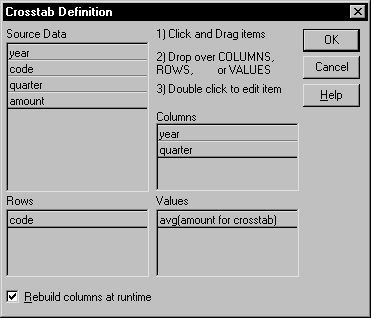
When a crosstab is generated from your definition, the appropriate computed fields are automatically created using the Crosstab functions. To understand the functions, consider a crosstab with two columns (year and quarter), a row (product), and the values expression Avg(amount for crosstab).
The Crosstab Definition dialog box looks like this.

When you define the crosstab described above, the painter automatically creates the appropriate computed fields. A computed field named avg_amount returns the average of the quarterly figures for each year. Its expression is:
CrosstabAvg(1, 2, "@year")
A second computed field named grand_avg_amount computes the average of all the amounts in the row. Its expression is:
CrosstabAvg(1)
Other computed fields in the summary band use the Avg function to display the average of the values in the amount column, the yearly averages, and the final average.
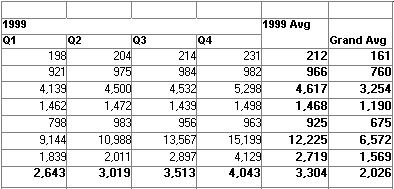
The crosstab in the Design view looks like this.

Each row in the crosstab (after adjusting the column widths) has cells for the amounts in the quarters, a repeating cell for the yearly average, and a grand average. The crosstab also displays averages of the amounts for all the financial codes in the quarters in the summary band at the bottom.


When the crosstab definition has more than one column, you can specify column qualifiers for any of the Crosstab functions, so that the crosstab displays calculations for groups of column values. As illustrated previously, when year and quarter are the columns in the crosstab, the expression for the computed field is:
CrosstabAvg(1, 2, "@year")
The value 2 refers to the quarter column (the second column in the Crosstab Definition dialog) and “@year” specifies grouping values from the year column (meaning the function will average values for the quarters within each year). The value 1 refers to the crosstab-values expression that will be averaged. In the resulting crosstab, the computed field repeats in each row after the cells for the quarters within each year.
When you define a crosstab with more than one column, the order of the columns in the Columns box of the Crosstab Definition dialog box governs the way the columns are grouped. To end up with the most effective expressions, make the column that contains the grouping values (for example, year or department) the first column in the Columns box and the column that contains the values to be grouped (for example, quarter or employee) second.
To display calculations for groups of rows, define groups as you would for other DataWindow presentation styles and define computed fields in the group header or footer using noncrosstab aggregation functions, such as Avg, Sum, or Max.
![]() Reviewing the expressions
To review the expressions defined for the crosstab values,
open the Crosstab Definition dialog box (select Design>Crosstab
from the menubar).
Reviewing the expressions
To review the expressions defined for the crosstab values,
open the Crosstab Definition dialog box (select Design>Crosstab
from the menubar).
The first two examples use the crosstab expressions shown below:
Count(emp_id for crosstab),Sum(salary for crosstab)
This expression for a computed field in the crosstab returns the average of the employee counts (the first expression):
CrosstabAvg(1)
This expression for a computed field in the crosstab returns the average of the salary totals (the second expression):
CrosstabAvg(2)
Consider a crosstab that has two columns (region and city) and the values expression Avg(sales for crosstab). This expression for a computed field in the detail band computes the average sales over all the cities in a region:
CrosstabAvg(1, 2, "@region")
This expression for another computed field in the same crosstab computes the grand average over all the cities:
CrosstabAvg(1)