![]()
![]()
![]()
![]()
You call the data-access methods after a graph has been created and populated with data. Some graphs, such as graphs that display data for a page or group of data, are destroyed and re-created internally as the user pages through the data. Any changes you made to the display of a graph, such as changing the color of a series, are lost when the graph is re-created.
To be assured that data-access methods are called whenever a graph has been created and populated with data, you can call the methods in the code for an event that is triggered when a graph is created. The event is:
PowerBuilder Event ID pbm_dwngraphcreate, which you can assign to a user event for a DataWindow control (described below)
The graph-creation event is triggered by the DataWindow control after it has created a graph and populated it with data, but before it has displayed the graph. By accessing the data in the graph in this event, you are assured that you are accessing the current data and that the data displays the way you want it.
PowerBuilder provides an event ID, pbm_dwngraphcreate, that you can assign to a user event for a DataWindow control.
![]() To access data properties of a graph in a DataWindow
control:
To access data properties of a graph in a DataWindow
control:
Place the DataWindow control in a window or user object and associate it with the DataWindow object containing the graph.
Next you create a user event for the DataWindow control that is triggered whenever a graph in the control is created or changed.
Select Insert>Event from the menu bar.
The Script view displays and includes prototype fields for adding a new event.
Select the DataWindow control in the first drop-down list of the prototype window.
If the second drop-down list also changes to display an existing DataWindow event prototype, scroll to the top of the list to select New Event or select Insert>Event once again from the menu bar.
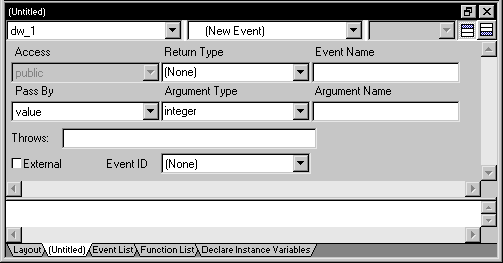
Name the user event you are creating.
For example, you might call it GraphCreate.
Select pbm_dwngraphcreate for the event ID.
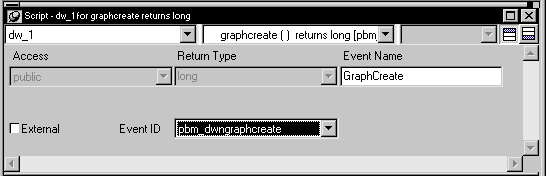
Click OK to save the new user event.
Write a script for the new GraphCreate event that accesses the data in the graph.
Calling data access methods in the GraphCreate event assures you that the data access happens each time the graph has been created or changed in the DataWindow.
PowerBuilder The following statement sets to black the foreground (fill) color of the Q1 series in the graph gr_quarter, which is in the DataWindow control dw_report. The statement is in the GraphCreate event, which is associated with the event ID pbm_dwngraphcreate in PowerBuilder:
dw_report.SetSeriesStyle("gr_quarter", "Q1", &
foreground!, 0)
The following statement changes the foreground (fill) color to red of the second data point in the Stellar series in the graph gr_sale in a window. The statement can be in a script for any event:
int SeriesNum
// Get the number of the series.
SeriesNum = gr_sale.FindSeries("Stellar")
// Change color of second data point to red
gr_sale.SetDataStyle(SeriesNum, 2, foreground!, 255)
Web ActiveX The following statement sets the foreground (fill) color to black in one of the series in the graph gr_quarter, which is in the DataWindow control dw_report. The statement is in the onGraphCreate event:
dw_report.SetSeriesStyleColor("gr_quarter", 1, 0, 0);
For complete information about the data-access graph methods, see the DataWindow Reference.
For more about PowerBuilder user events, see the PowerBuilder Users Guide.
