You must build a Pipeline object to specify the data definition and access aspects of the pipeline that you want your application to execute. Use the Data Pipeline painter in PowerBuilder to create this object and define the characteristics you want it to have.
Among the characteristics you can define in the Data Pipeline painter are:
The source tables to access and the data to retrieve from them (you can also access database stored procedures as the data source)
The destination table to which you want that data piped
The piping operation to perform (create, replace, refresh, append, or update)
The frequency of commits during the piping operation (after every n rows are piped, or after all rows are piped, or not at all—if you plan to code your own commit logic)
The number of errors to allow before the piping operation is terminated
Whether or not to pipe extended attributes to the destination database (from the PowerBuilder repository in the source database)
For full details on using the Data Pipeline painter to build your Pipeline object, see the PowerBuilder Users Guide.
Here is an example of how you would use the Data Pipeline painter to define a Pipeline object named pipe_sales_extract1 (one of two Pipeline objects employed by the w_sales_extract window in a sample order entry application).
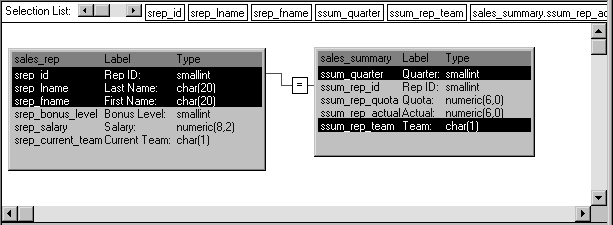
The source data to pipe This Pipeline object joins two tables (Sales_rep and Sales_summary) from the company’s sales database to provide the source data to be piped. It retrieves just the rows from a particular quarter of the year (which the application must specify by supplying a value for the retrieval argument named quarter):

Notice that this Pipeline object also indicates specific columns to be piped from each source table (srep_id, srep_lname, and srep_fname from the Sales_rep table, as well as ssum_quarter and ssum_rep_team from the Sales_summary table). In addition, it defines a computed column to be calculated and piped. This computed column subtracts the ssum_rep_quota column of the Sales_summary table from the ssum_rep_actual column:

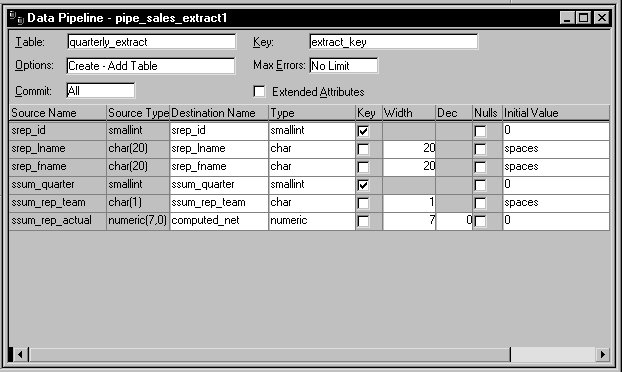
How to pipe the data The details of how pipe_sales_extract1 is to pipe its source data are specified here:

Notice that this Pipeline object is defined to create a new destination table named Quarterly_extract. A little later you will learn how the application specifies the destination database in which to put this table (as well as how it specifies the source database in which to look for the source tables).
Also notice that:
A commit will be performed only after all appropriate rows have been piped (which means that if the pipeline’s execution is terminated early, all changes to the Quarterly_extract table will be rolled back).
No error limit is to be imposed by the application, so any number of rows can be in error without causing the pipeline’s execution to terminate early.
No extended attributes are to be piped to the destination database.
The primary key of the Quarterly_extract table is to consist of the srep_id column and the ssum_quarter column.
The computed column that the application is to create in the Quarterly_extract table is to be named computed_net.