The ROLLUP operator requires an ordered list of grouping expressions to be supplied as arguments.
ROLLUP syntax.
SELECT … [ GROUPING (column-name) … ] …
GROUP BY [ expression [, …]
| ROLLUP ( expression [, …] ) ]
GROUPING takes a column name as a parameter and returns a Boolean value as listed in the following table:
If the value of the result is |
GROUPING returns |
|---|---|
NULL created by a ROLLUP operation |
1 (TRUE) |
NULL indicating the row is a subtotal |
1 (TRUE) |
Not created by a ROLLUP operation |
0 (FALSE) |
A stored NULL |
0 (FALSE) |
ROLLUP first calculates the standard aggregate values specified in the GROUP BY clause. Then ROLLUP moves from right to left through the list of grouping columns and creates progressively higher-level subtotals. A grand total is created at the end. If n is the number of grouping columns, then ROLLUP creates n+1 levels of subtotals.
This SQL Syntax... |
Defines the Following Sets... |
|---|---|
GROUP BY ROLLUP (A, B, C); |
(A, B, C) (A, B) (A) ( ) |
ROLLUP and subtotal rows
ROLLUP is equivalent to a UNION of a set of GROUP BY queries. The result sets of the following queries are identical. The result set of GROUP BY (A, B) consists of subtotals over all those rows in which A and B are held constant. To make a union possible, column C is assigned NULL.
This ROLLUP Query... |
Is Equivalent to This Query Without ROLLUP... |
|---|---|
select year(orderdate) as year, quarter(orderdate) as Quarter, count(*) Ordersfrom SalesOrdersgroup by Rollup (year, quarter)order by year, quarter |
Select null,null, count(*) Orders from SalesOrdersunion allSELECT year(orderdate) AS YEAR, NULL, count(*) Orders from SalesOrdersGROUP BY year(orderdate) union allSELECT year(orderdate) as YEAR, quarter(orderdate) as QUATER, count(*) Orders from SalesOrdersGROUP BY year(orderdate), quarter(orderdate) |
Subtotal rows can help you analyze data, especially if there are large amounts of data, different dimensions to the data, data contained in different tables, or even different databases altogether. For example, a sales manager might find reports on sales figures broken down by sales representative, region, and quarter to be useful in understanding patterns in sales. Subtotals for the data give the sales manager a picture of overall sales from different perspectives. Analyzing this data is easier when summary information is provided based on the criteria that the sales manager wants to compare.
With OLAP, the procedure for analyzing and computing row and column subtotals is invisible to users.
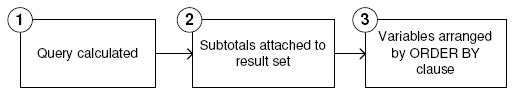
This step yields an intermediate result set that has not yet considered the ROLLUP.
Subtotals are evaluated and attached to the result set.
The rows are arranged according to the ORDER BY clause in the query.
NULL values and subtotal rows
When rows in the input to a GROUP BY operation contain NULL, there is the possibility of confusion between subtotal rows added by the ROLLUP or CUBE operations and rows that contain NULL values that are part of the original input data.
The Grouping() function distinguishes subtotal rows from others by taking a column in the GROUP BY list as its argument, and returning 1 if the column is NULL because the row is a subtotal row, and 0 otherwise.
The following example includes Grouping() columns in the result set. Rows are highlighted that contain NULL as a result of the input data, not because they are subtotal rows. The Grouping() columns are highlighted. The query is an outer join between the Employees table and the SalesOrders table. The query selects female employees who live in Texas, New York, or California. NULL appears in the columns corresponding to those female employees who are not sales representatives (and therefore have no sales).
SELECT Employees.EmployeeID as EMP, year(OrderDate) as
  YEAR, count(*) as ORDERS, grouping(EMP) as
  GE, grouping(YEAR) as GY
  FROM Employees LEFT OUTER JOIN SalesOrders on
  Employees.EmployeeID = SalesOrders.SalesRepresentative
  WHERE Employees.Sex IN ('F') AND Employees.State
  IN ('TX', 'CA', 'NY')
GROUP BY ROLLUP (YEAR, EMP)
ORDER BY YEAR, EMP
The preceding query returns:
EMP         YEAR      ORDERS     GE     GY
------      ----      ------     --     --
NULL        NULL           5      1      0
NULL        NULL         169      1      1
 102        NULL           1      0      0
 309        NULL           1      0      0
1062        NULL           1      0      0
1090        NULL           1      0      0
1507        NULL           1      0      0
NULL        2000          98      1      0
 667        2000          34      0      0
 949        2000          31      0      0
1142        2000          33      0      0
NULL        2001          66      1      0
 667        2001          20      0      0
949         2001          22      0      0
1142        2001          24      0      0
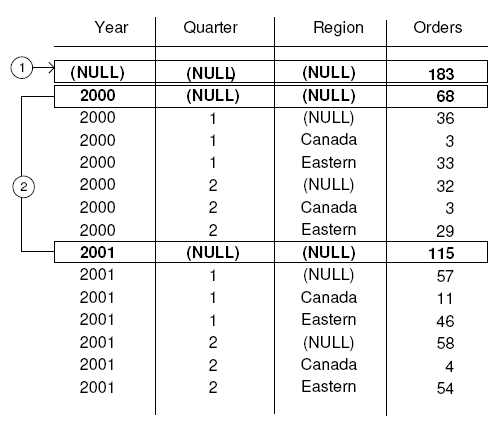
For each prefix, a subtotal row is constructed that corresponds to all rows in which the prefix columns have the same value.
To demonstrate ROLLUP results, examine the example query again:
SELECT year (OrderDate) AS Year, quarter
  (OrderDate) AS Quarter, COUNT (*) Orders
FROM SalesOrders
  GROUP BY ROLLUP (Year, Quarter)
  ORDER BY Year, Quarter
In this query, the prefix containing the Year column leads to a summary row for Year=2000 and a summary row for Year=2001. A single summary row for the prefix has no columns, which is a subtotal over all rows in the intermediate result set.
The value of each column in a subtotal row is as follows:
-
Column included in the prefix – the value of the column. For example, in the preceding query, the value of the Year column for the subtotal over rows with Year=2000 is 2000.
-
Column excluded from the prefix – NULL. For example, the Quarter column has a value of NULL for the subtotal rows generated by the prefix consisting of the Year column.
-
Aggregate function – an aggregate over the values of the excluded columns.
Subtotal values are computed over the rows in the underlying data, not over the aggregated rows. In many cases, such as SUM or COUNT, the result is the same, but the distinction is important in the case of statistical functions such as AVG, STDDEV, and VARIANCE, for which the result differs.
-
The ROLLUP operator supports all of the aggregate functions available to the GROUP BY clause except COUNT DISTINCT and SUM DISTINCT.
-
ROLLUP can only be used in the SELECT statement; you cannot use ROLLUP in a subquery.
-
A grouping specification that combines multiple ROLLUP, CUBE, and GROUP BY columns in the same GROUP BY clause is not currently supported.
-
Constant expressions as GROUP BY keys are not supported.
ROLLUP example 2—The following example illustrates the use of ROLLUP and GROUPING and displays a set of mask columns created by GROUPING. The digits 0 and 1 displayed in columns S, N, and C are the values returned by GROUPING to represent the value of the ROLLUP result. A program can analyze the results of this query by using a mask of “011” to identify subtotal rows and “111” to identify the row of overall totals.
SELECT size, name, color, SUM(quantity),
  GROUPING(size) AS S,
  GROUPING(name) AS N,
  GROUPING(color) AS C
FROM Products
GROUP BY ROLLUP(size, name, color) HAVING (S=1 or N=1 or C=1)
ORDER BY size, name, color;
The preceding query returns:
size               name           color     SUM  S  N  C
----               -----          ------     ---  -  -  -
(NULL)             (NULL)          (NULL)    496  1  1  1
Large              (NULL)          (NULL)     71  0  1  1
Large              Sweatshirt      (NULL)     71  0  0  1
Medium             (NULL)          (NULL)    134  0  1  1
Medium             Shorts          (NULL)     80  0  0  1
Medium             Tee Shirt       (NULL)     54  0  0  1
One size fits all  (NULL)          (NULL)    263  0  1  1
One size fits all  Baseball Cap    (NULL)    124  0  0  1
One size fits all  Tee Shirt       (NULL)     75  0  0  1
One size fits all  Visor           (NULL)     64  0  0  1
Small              (NULL)          (NULL)     28  0  1  1
Small              Tee Shirt       (NULL)     28  0  0  1
ROLLUP example 3—The following example illustrates the use of GROUPING to distinguish stored NULL values and “NULL” values created by the ROLLUP operation. Stored NULL values are then displayed as [NULL] in column prod_id, and “NULL” values created by ROLLUP are replaced with ALL in column PROD_IDS, as specified in the query.
SELECT year(ShipDate) AS Year,
				ProductID, SUM(quantity)AS OSum,
CASE
		WHEN GROUPING(Year) = 1
		THEN 'ALL'
		ELSE
		CAST(Year AS char(8))
END,
CASE
		WHEN GROUPING(ProductID) = 1
		THEN 'ALL'
		ELSE
		CAST(ProductID as char(8))
END
FROM SalesOrderItems
GROUP BY ROLLUP(Year, ProductID) HAVING OSum > 36
ORDER BY Year, ProductID;
The preceding query returns:
Year  ProductID  OSum  ...(Year)...  ...(ProductID)...
---------     -------   ---   ----------   --------
NULL           NULL   28359   ALL          ALL
2000           NULL   17642   2000         ALL
2000           300     1476   2000         300
2000           301     1440   2000         301
2000           302     1152   2000         302
2000           400     1946   2000         400
2000           401     1596   2000         401
2000           500     1704   2000         500
2000           501     1572   2000         501
2000           600     2124   2000         600
2000           601     1932   2000         601
2000           700     2700   2000         700
2001           NULL   10717   2001         ALL
2001           300      888   2001         300
2001           301      948   2001         301
2001           302      996   2001         302
2001           400     1332   2001         400
2001           401     1105   2001         401
2001           500      948   2001         500
2001           501      936   2001         501
2001           600      936   2001         600
2001           601      792   2001         601
2001           700     1836   2001         700
ROLLUP example 4—The next example query returns data that summarizes the number of sales orders by year and quarter.
SELECT year (OrderDate) AS Year,
quarter(OrderDate) AS Quarter, COUNT (*) Orders
FROM SalesOrders
GROUP BY ROLLUP (Year, Quarter)
ORDER BY Year, Quarter
The following figure illustrates the query results with subtotal rows highlighted in the result set. Each subtotal row contains a NULL value in the column or columns over which the subtotal is computed.
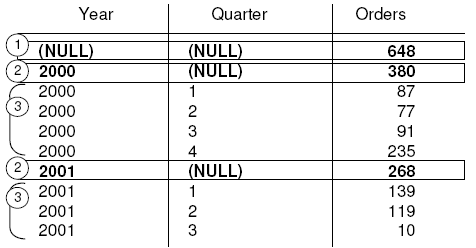
Row [1] represents the total number of orders across both years (2000, 2001) and all quarters. This row contains NULL in both the Year and Quarter columns and is the row where all columns were excluded from the prefix.
Row [2] represent the total number of orders in the years 2000 and 2001, respectively. Both rows contain NULL in the Quarter column because the values in that column are rolled up to give a subtotal for Year. The number of rows like this in your result set depends on the number of variables that appear in your ROLLUP query.
The remaining rows marked [3] provide summary information by giving the total number of orders for each quarter in both years.
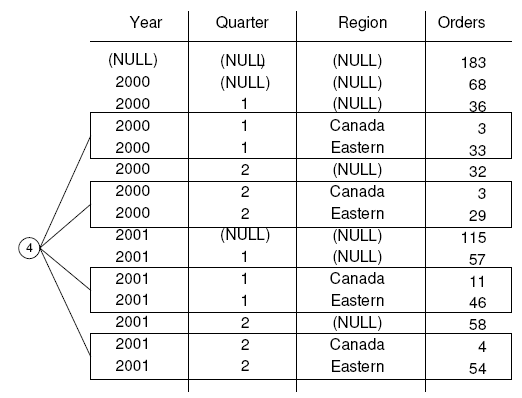
ROLLUP example 5—This example of the ROLLUP operation returns a slightly more complicated result set, which summarizes the number of sales orders by year, quarter, and region. In this example, only the first and second quarters and two selected regions (Canada and the Eastern region) are examined.
SELECT year(OrderDate) AS Year, quarter(OrderDate)AS Quarter, region, COUNT(*) AS Orders
FROM SalesOrders WHERE region IN ('Canada','Eastern') AND quarter IN (1, 2)
GROUP BY ROLLUP (Year, Quarter, Region)ORDER BY Year, Quarter, Region
The following figure illustrates the result set from the above query. Each subtotal row contains a NULL in the column or columns over which the subtotal is computed.
Row [1] is an aggregate over all rows and contains NULL in the Year, Quarter, and Region columns. The value in the Orders column of this row represents the total number of orders in Canada and the Eastern region in quarters 1 and 2 in the years 2000 and 2001.
The rows marked [2] represent the total number of sales orders in each year (2000) and (2001) in quarters 1 and 2 in Canada and the Eastern region. The values of these rows [2] are equal to the grand total represented in row [1].
The rows marked [3] provide data about the total number of orders for the given year and quarter by region.
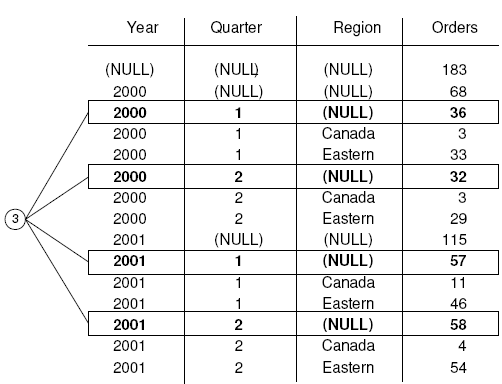
The rows marked [4] provide data about the total number of orders for each year, each quarter, and each region in the result set.