In visual authoring, you use diagrams to create and manipulate the streams, windows, connections, and other components of a project, and create simple queries.
When you open a project in the Visual editor, the project shows a collection of stream and window shapes that are connected with arrows showing the flow of data. You develop the project by selecting new input and output streams, windows, and other elements from the Palette, dropping them onto the diagram, connecting them, and configuring their behavior.
Every project has at least one diagram. A diagram in the Visual editor is a projection of the associated CCL statements in the project.
When you add a shape or other element to a diagram, it is automatically added to the project when you save. You can delete an element from a diagram only, or from the project.
- iconic – compartments are collapsed to save space.
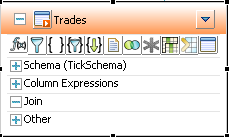
- verbose – all compartments in elements are visible.

- To expand or collapse all shapes in the diagram, use the All Verbose
or All Iconic
buttons on the main toolbar.
- To expand an individual shape, select it and click the "+" box in the shape.
- To collapse an individual shape, select it and click the "-" box in the shape header.