Learn about the parts of a graph.
Here is a column graph created in PowerBuilder that contains most major parts of a graph. It shows quarterly sales of three products: Stellar, Cosmic, and Galactic printers.
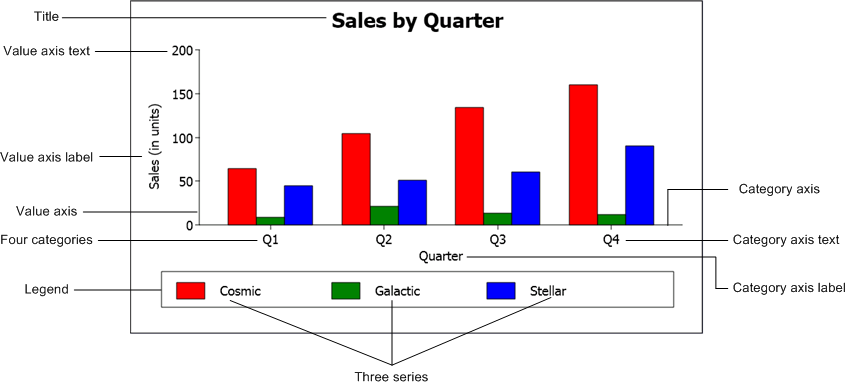
How data is represented
Graphs display data points. To define graphs, you need to know how the data is represented. PowerBuilder organizes data into three components.
| Component | Description | Meaning |
|---|---|---|
| Series | Set of data points | Each set of related data points makes up one series. Each series in a graph is distinguished by color, pattern, or symbol. |
| Categories | Major divisions of the data | Series data is divided into categories, which are often non-numeric. Categories represent values of the independent variables. |
| Values | Data point values | The values for the data points (dependent variables). |
Organization of a graph
| Part | Represents |
|---|---|
| Title | An optional title, appearing at the top of the graph. |
| Value axis | The axis of the graph along which the values of the dependent variable(s) are plotted. In a column graph, for example, the Value axis corresponds to the y axis in an XY presentation. In other types of graphs, such as a bar graph, the Value axis may be along the x dimension. |
| Category axis | The axis along which are plotted the major divisions of the data, representing the independent variable(s). In column graphs, the Category axis corresponds to the x axis in an XY presentation. These form the major divisions of data in the graph. |
| Series | A set of data points. In bar and column charts, each series is represented by bars or columns of one color or pattern. |
| Series axis | The axis along which the series are plotted in three-dimensional (3-D) graphs. |
| Legend | An optional listing of the series. The preceding graph contains a legend that shows how each series is represented in the graph. |