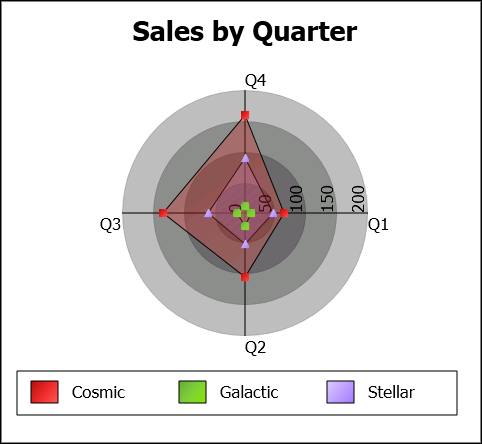
Radar graphs graphically display multivariate data (with three or more quantitative variables) in a two-dimensional chart represented on axes starting from the same point.
Radar graphs display data points on radii, displaying the data in a way that allows you to see patterns such as dominant variables, outliers, and other data patterns.