One of the advantages of creating a grouped DataWindow object is that you can have PowerBuilder calculate statistics for each group. To do that, you place computed fields that reference the group. Typically, you place these computed fields in the group’s trailer band.
Select Insert>Control>Computed Field from the menu bar.
Click in the Design view where you want the statistic.
The Modify Expression dialog box displays.
Specify the expression that defines the computed field (see below).
Click OK.
![]() A shortcut to sum values
If you want to sum a numeric column, select the column in
Design view and click the Sum button in the Controls drop-down toolbar. PowerBuilder automatically
places a computed field in the appropriate band.
A shortcut to sum values
If you want to sum a numeric column, select the column in
Design view and click the Sum button in the Controls drop-down toolbar. PowerBuilder automatically
places a computed field in the appropriate band.
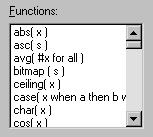
Typically, you use aggregate and other functions in your summary statistic. PowerBuilder lists functions you can use in the Functions box in the Modify Expression dialog box. When you are defining a computed field in a group header or trailer band, PowerBuilder automatically lists forms of the functions that reference the group:

You can paste these templates into the expression, then replace the #x that is pasted in as the function argument with the appropriate column or expression.
For example, to count the employees in each department (group 1), specify this expression in the group trailer band:
Count( Emp_Id for group 1 )
To get the average salary of employees in a department, specify:
Avg( Salary for group 1 )
To get the total salary of employees in a department, specify:
Sum( Salary for group 1 )
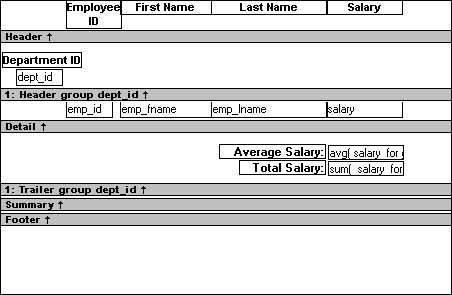
The group trailer band in this example shows the average and total salary for the group.

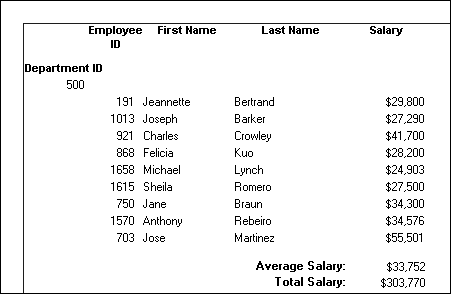
At runtime, the average and total salaries are calculated and displayed:
