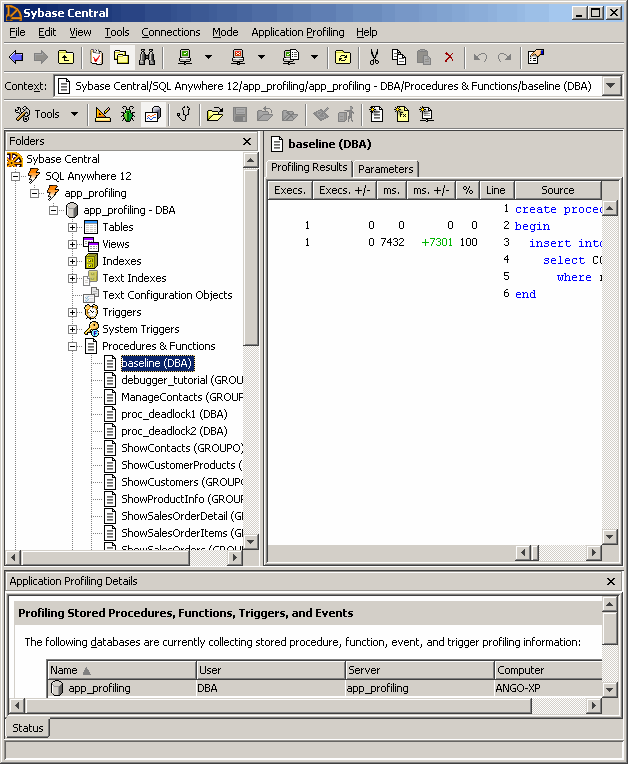
 Compare the procedure profiling results
In Sybase Central, click Mode » Application Profiling.
If the Application Profiling Wizard appears, click Cancel.
In the left pane of Sybase Central, in Procedures & Functions, click the baseline procedure.
In the right pane, click the Profiling Results tab.
Click View » Refresh Folder.
Two new columns, Execs. +/- and ms. +/-, appear.

The Execs. +/- and ms. +/- columns result from comparing statistics in the profiling log file to the statistics captured during the most recent execution of the procedure. Specifically, they compare number of executions and duration of execution, respectively, for each line of code in the procedure.
Typically, you are interested in the ms. +/- column, which indicates whether you improved the execution time for lines of code in the procedure. Faster times are indicated by a minus sign and red font. Slower times are indicated by no sign, and green font. In this tutorial, the value in the ms. +/- column should be a + sign along with an execution time in green font. The INSERT statement in the updated procedure has a slower time than the INSERT statement in the baseline procedure.
You have completed the tutorial on baselining with procedure profiling.
 See also
 |
Discuss this page in DocCommentXchange.
|
Copyright © 2012, iAnywhere Solutions, Inc. - SQL Anywhere 12.0.1 |