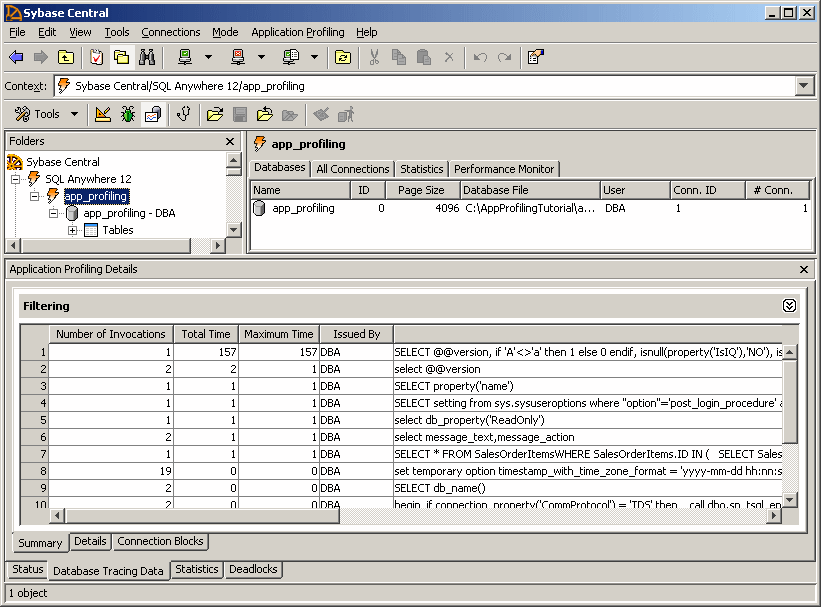
You can identify which statements the database server spends the most time processing by using the Summary and Detail tabs, located on the Application Profiling pane in Sybase Central.
 Review statements processed by the database server
Open the analysis file as follows:
In Sybase Central, click Mode » Application Profiling. If the Application Profiling Wizard appears, click Cancel.
Click Application Profiling » Open Analysis File Or Connect To A Tracing Database.
Click In A Tracing Database, and then click Open.
In the User ID field, type DBA.
In the Password field, type sql.
In the Action dropdown list, click Connect To A Running Database On This Computer.
In the Database Name field, type app_profiling.
Click Connect.
If the Application Profiling Details pane does not appear at the bottom of the window, click View » Application Profiling Details.
Examine the statement execution times of statements that were processed during the tracing session, as follows:
On the Status tab in the Application Profiling Details pane, select the most recent ID (highest number) from the Logging Session ID field, and then click the Database Tracing Data tab.
On the Summary tab, the SQL statements you executed during the session appear. You may see additional statements as well. This is because statements you executed automatically caused other statements to be executed (for example, a trigger).
The Summary tab groups similar statements together and summarizes the total number of invocations and the total time spent processing them. SELECT, INSERT, UPDATE, and DELETE statements are grouped together by what tables, columns, and expressions they reference. Other statements are grouped together as a whole (for example, all CREATE TABLE statements appear as a single entry in the Summary tab). A statement may appear expensive in the Summary tab because it is an expensive statement, or because it is frequently executed.
Find statements that are running slowly on your system by examining the Total Time and Maximum Time columns. These provide information about the execution times for each statement processed by the database server.

To view information about the connection that executed a statement, go to the Details tab, right-click the statement and click View Connection Details For The Selected Statement.
To view the execution plan used for a SQL statement, go to the Details tab, right-click the statement and click View More SQL Statement Details For The Selected Statement.
The SQL Statement Details window appears, displaying the full text of the statement along with details about the context in which it was used. The text displayed for the statement may not match the original SQL statement you executed. Instead, the SQL Statement Details window displays the statement in its rewritten form, as it was processed by the database server. For example, queries over views may appear very different, since the view definitions are often rewritten by the optimizer when executing the query.
Click the Query Information tab at the bottom of the SQL Statement Details window to see the execution plan.
You have completed the tutorial on diagnosing slow statements.
 See also
 |
Discuss this page in DocCommentXchange.
|
Copyright © 2012, iAnywhere Solutions, Inc. - SQL Anywhere 12.0.1 |