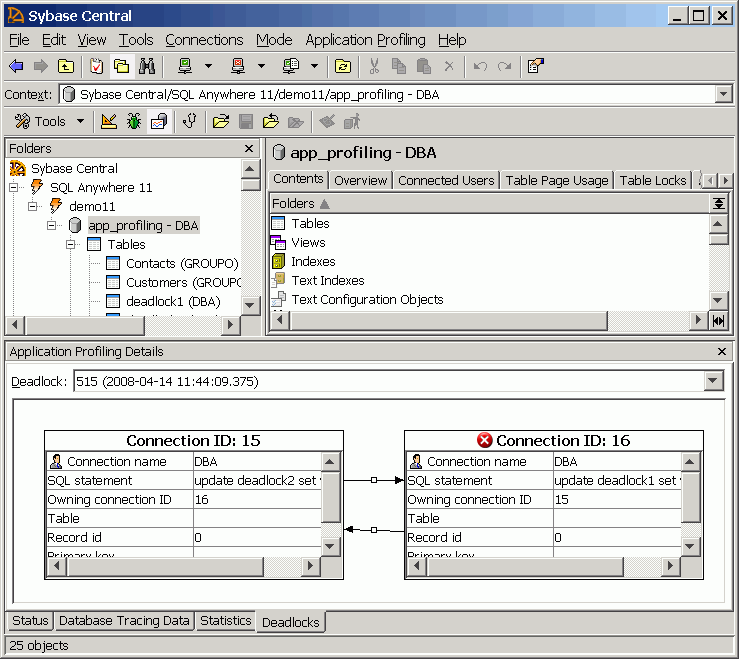
The Application Profiling mode provides a graphical representation of the connections participating in the deadlock. It also provides a Connection Blocks tab that provides additional information on the blocked connections.
Open the analysis file created during the tracing session.
In Sybase Central, choose Application Profiling » Open Analysis File Or Connect To A Tracing Database.
Select In A Tracing Database.
Click Open.
Click the Identification tab, and type DBA in the User ID field and sql in the Password field.
Click the Database tab, and in the Database File field, browse to and select app_profiling - DBA.
Click OK.
View the graphical representation of the deadlock.
In the Application Profiling Details pane click the Status tab and choose the most recent ID from the Logging Session ID list.
If the Application Profiling Details pane does not appear, choose View » Application Profiling Details.
At the bottom of the Application Profiling Details pane, click the Deadlocks tab. The most recent deadlock appears. Click the Deadlock list to view additional deadlocks.
The following image shows how the UPDATE statements created a deadlock condition.

Each connection involved in the deadlock is represented by a table with the following fields:
Connection Name This field shows the user ID that opened the connection.
SQL Statement This field shows the actual statement involved in the deadlock. In this case, the deadlock was caused by the UPDATE statements found in the procedures you executed from each instance of Interactive SQL.
Owning Connection ID This field shows the ID of the connection that blocked the current connection.
Record ID This field shows the ID of the row that the current connection is blocked on.
Rollback Operation Count This field shows the number of operations that must be rolled back as a result of the deadlock. In this case, the procedures contained only the UPDATE statements, so the count is 0.
| Discuss this page in DocCommentXchange. Send feedback about this page using email. |
Copyright © 2009, iAnywhere Solutions, Inc. - SQL Anywhere 11.0.1 |