![]()
![]()
![]()
![]()
Use this tutorial to learn how to use the Database Tracing Wizard to view execution times for statements, and how to identify statements that appear to run slowly.
A slow statement occurs when the database server takes a long time to process the statement. Long processing times can be the result of several issues such as an improperly designed database, poor use of indexes, index and table fragmentation, a small cache size, and so on. A statement may also run slowly because it is not well formed, or does use more efficient shortcuts to achieve results.
This tutorial does not show you how to rewrite slow statements, since each statement can have special requirements. However, the tutorial does show you where to look for execution times, and how to compare execution times when rewriting queries using alternate syntax.
This tutorial assumes you have followed the setup steps for the application profiling tutorials. If you have not, see Setting up for the application profiling tutorials.
The Database Tracing Wizard is used to create a diagnostic tracing session. The tracing session captures processing statement data which includes duration times.
You can copy and paste the SQL statements in this tutorial into Interactive SQL.
To use the Database Tracing Wizard to create a tracing session
Start Sybase Central and connect to the test database app_profiling.db with the user ID DBA and the password sql.
If you have not created the test database, see Setting up for the application profiling tutorials.
If you are unfamiliar with starting Sybase Central and connecting to a database, see Connecting to a database on your own computer from Sybase Central or Interactive SQL.
Start the Database Tracing Wizard.
The Database Tracing Wizard appears.
In Sybase Central, in the left pane, select the app_profiling - DBA database, and then choose File » Open Interactive SQL.
Interactive SQL starts and connects to the app_profiling - DBA database.
In Interactive SQL, run the following SQL statement.
SELECT SalesOrderItems.ID, LineID, ProductID, SalesOrderItems.Quantity, ShipDate FROM SalesOrderItems, SalesOrders WHERE SalesOrders.CustomerID = 105 AND SalesOrderItems.ID=SalesOrders.ID; |
In Interactive SQL, run the following SQL statement. This query returns the same results as the previous query, but uses a uncorrelated subquery.
SELECT * FROM SalesOrderItems WHERE SalesOrderItems.ID IN ( SELECT SalesOrders.ID FROM SalesOrders WHERE SalesOrders.CustomerID = 105 ); |
Exit Interactive SQL.
In Sybase Central, select the database and then choose File » Tracing » Stop Tracing With Save to stop the tracing session.
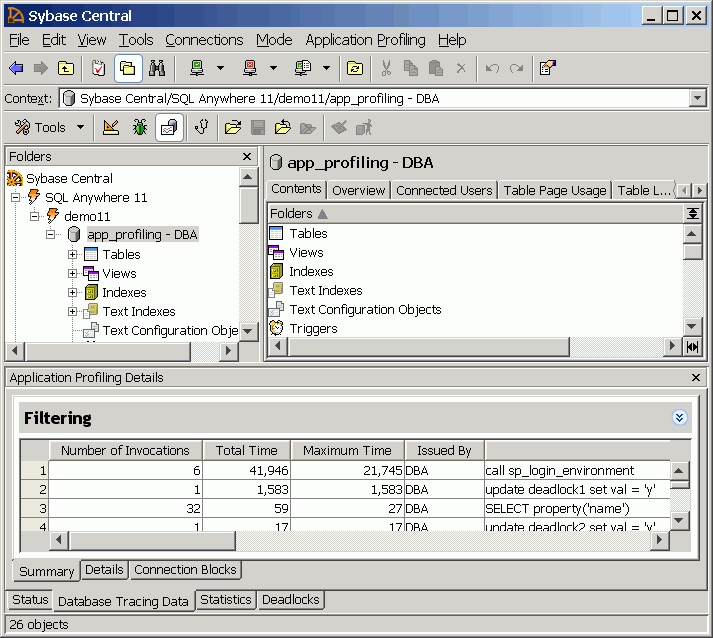
You can identify which statements the database server spends the most time processing by using the Summary and Detail tabs, located in Application Profiling pane in Sybase Central.
To view the Summary and Details tabs
Open the analysis file.
The Open Analysis Or Connect To Tracing Database window appears.
If the Application Profiling Details pane does not appear at the bottom of the window, choose View » Application Profiling Details.
Examine statement execution times of statements that were processed during the tracing session.
On the Summary tab, the SQL statements you executed during the session appear. You may see more additional statements as well. This is because statements you executed automatically caused other statements to be executed (for example, a trigger).
The Summary tab groups similar statements together and summarizes the total number of invocations and the total time spent processing them. SELECT, INSERT, UPDATE, and DELETE statements are grouped together by what tables, columns, and expressions they reference. Other statements are grouped together as a whole (for example, all CREATE TABLE statements appear as a single entry in the Summary tab). A statement may appear expensive in the Summary tab because it is an expensive statement, or because it is frequently executed.
Use the Total Time and Maximum Time columns to examine the execution times for the two queries you executed earlier in this tutorial. The first query shows a total time of 20 milliseconds for execution. The second query shows a faster execution time (16 milliseconds), indicating that the second query, which uses a uncorrelated subquery, may be a more efficient syntax to use.
To view additional information about any SQL statement in the Summary tab, right-click the statement and choose Show The Detailed SQL Statements For The Selected Summary SQL Statement.
The SQL Statement Details window appears, displaying the full text of the statement along with details about the context in which it was used. Note that the text displayed for the statement may not match the original SQL statement you executed. Instead, the SQL Statement Details window displays the statement in its rewritten form, as it was processed by the database server. For example, queries over views may appear very different, since the view definitions are often rewritten by the optimizer when executing the query.
To view the execution plan, click the Query Information tab.
For information about the Database Tracing Wizard, see Advanced application profiling using diagnostic tracing.
For more information on the items shown in the execution plan, see Reading execution plans.
For information about correlated and uncorrelated subqueries, see Using subqueries.
For information about using the Summary and Details tabs, see Performing request trace analysis.
See also:
| Send feedback about this page via email or DocCommentXchange | Copyright © 2008, iAnywhere Solutions, Inc. - SQL Anywhere 11.0.0 |