![]()
![]()
![]()
![]()
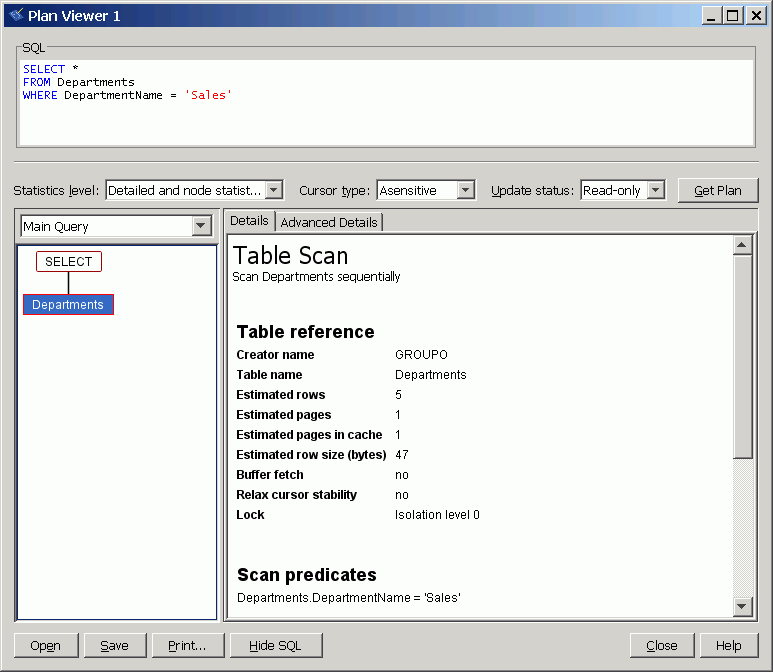
In the example shown below, the selected node represents a scan of the Departments table, and the statistics pane shows the Predicate as the search condition, its selectivity estimation, and its real selectivity.
In the Details pane, statistics about an individual node are divided into three sections: Node Statistics, Subtree Statistics, and Optimizer Statistics.
Node statistics pertain to the execution of this specific node. If the node is not a leaf node in the plan, and therefore consumes an intermediate result(s) from other nodes, the Details pane shows a Subtree Statistics section that contains estimated and actual cumulative statistics for this node's entire subtree. Optimizer statistics information is present only for root nodes, which represent the entire SQL request.
Selectivity information may not be displayed for simple queries that qualify for optimization bypass. For more information about simple queries, see How the optimizer works.
The access plan depends on the statistics available in the database, which, in turn, depends on what queries have previously been executed. You may see different statistics and plans from those shown here.
This predicate description is
Departments.DepartmentName = 'Sales' : 20% Column; true 1/5 20% |
This can be read as follows:
Departments.DepartmentName = 'Sales' is the predicate.
20% is the optimizer's estimate of the selectivity. That is, the optimizer is basing its query access selection on the estimate
that 20% of the rows satisfy the predicate.
This is the same output as is provided by the ESTIMATE function. For more information, see ESTIMATE function [Miscellaneous].
Column is the source of the estimate. This is the same output as is provided by the ESTIMATE_SOURCE function. For a complete list
of the possible sources of selectivity estimates, see ESTIMATE_SOURCE function [Miscellaneous].
true 1/5 20% is the actual selectivity of the predicate during execution. The predicate was evaluated five times, and was true once, hence
its real selectivity is 20%.
If the actual selectivity is very different from the estimate, and if the predicate was evaluated a large number of times, it is possible that the incorrect estimates are causing a significant problem in query performance. Collecting statistics on the predicate may improve performance by giving the optimizer better information on which to base its choices.
If you select the graphical plan, but not the graphical plan with statistics, the final two statistics are not displayed.
| Send feedback about this page via email or DocCommentXchange | Copyright © 2008, iAnywhere Solutions, Inc. - SQL Anywhere 11.0.0 |