![]()
![]()
![]()
![]()
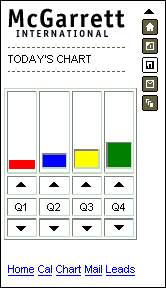
Many applications involve some sort of graphic display of information. The chart page in this sample application presents a bar chart with data for four quarters and allows the user to adjust any quarter's value up or down by tapping an up or down arrow for that quarter. For a full listing of the DHTML source code for this page, see Chart page sample: dynamically changing graphic information.
The chart page, as it displays initially, is shown in the following figure.
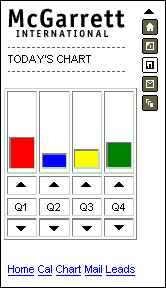
Each quarter has an up arrow and a down arrow which the user can tap to increase or decrease, respectively, the value displayed for that quarter. The chart page, as it might look after some user interaction, is shown in the figure below.
The DHTML code first assigns a variable for each quarter an index value, then initializes the color and revenue values for the quarters in a JavaScript array—this is like a mini-database inside the Web page:
    //
    // Globals
    //
    var intQ1 = 0;
    var intQ2 = 1;
    var intQ3 = 2;
var intQ4 = 3; |
    //
    // [bar chart color, initial revenue in millions]
    //
var arrQ = [["red", 7], ["blue", 12], ["yellow", 15], ["green", 21]]; |
Each quarter's up arrow icon is set up with an onclick event handler to call the BumpUp() function, passing the index for that quarter. The code for quarter 1 is shown below:
<td align="center" onclick="BumpUp(intQ1)"> <img src="open.gif" border="0" width="16" height="11"> </td> |
Similarly, each quarter's down arrow icon is set up with an onclick event handler to call the BumpDown() function, passing the index for that quarter.
The BumpUp() function accepts the quarter index passed as the local variable intQ_IN.
function BumpUp(intQ_IN)
{

    if (arguments.length != 1)
        throw new Error("function BumpUp() incorrectly called");

    var obj = document.getElementById("Q" + (intQ_IN + 1) +  "_Bar");
|
    if (arrQ[intQ_IN][intQ_Rev] < 53)
    {
        arrQ[intQ_IN][intQ_Rev] += 6;
        obj.style.height = arrQ[intQ_IN][intQ_Rev] + "px";
        obj.style.width = "20px";
        obj.style.backgroundColor = arrQ[intQ_IN][intQ_Color];
    }
|
return; } // BumpUp |
The BumpDown() function works much the same way, but it decrements the height of the bar for the quarter.
| Send feedback about this page using email. | Copyright © 2008, iAnywhere Solutions, Inc. |