Specifying more than one row or column

Typically you specify one database column as the Columns definition and one database column for the Rows definition, as in the printer crosstab. But you can specify as many columns (or expressions) as you want.

For example, consider a crosstab that has the same specification as the crosstab in “Viewing the crosstab”, except that two database columns, quarter and rep, have been dragged to the Columns box.

DataWindow Designer displays this in the Design view:
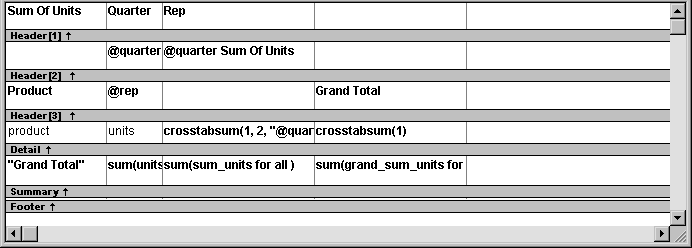
The sample in the Design view shows Header one at the top defined as Sum of Units, Quarter, and Rep. Next is Header two, shown as blank, @ quarter, and @ quarter Sum of Units. Header three includes Product, @ rep, a blank, and Grand Total. Next is Detail, which includes product, units, and crosstabsum ( one, two, "@ quar, and cross tab sum ( one ). Next is Summary, shown as "Grand Total" and the expression sum ( units, sum ( sum _ units for all ), and sum ( grand _ sum _ units for. Some of the displayed expressions are truncated in the sample, but the  Design view allows you to scroll to see the full expressions. Last is footer, with no footer text displayed.

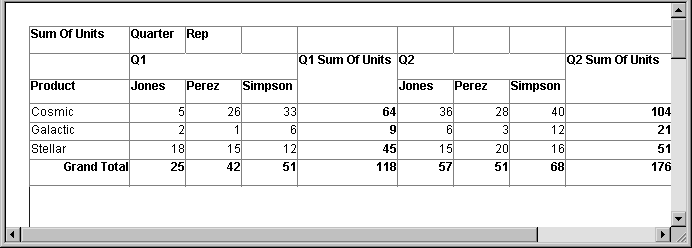
This is what you see at runtime:

The sample is titled Sum of Units, Quarter, and Rep. Below the title are five columns that include a blank and headings for Q one, Q one Sum of Units, Q two, and Q two Sum of Units. Under the blank is a column heading for Product; under it are  three rows for the three products. Under Q one and Q two are three columns each for individual sales reps. Cells in these columns display the reps’ sales totals for each product for that quarter. The Q one and Q two Sum of Units columns show totals for each product for all three sales reps. The bottom row of the cross tab shows the grand totals for each rep for each product and the grand total Q one and Q 2 sum of units.

For each quarter, the crosstab shows sales of each printer by each sales representative.