Creating a report using the Composite presentation style

StepsTo create a report using the Composite presentation style:

  1. Select File>New from the menu bar.

    The New Report dialog box displays.

  2. Choose the DataWindow tab page and the Composite presentation style, and click OK.

    The wizard displays all reports (DataWindow objects) that are in the current project’s library search path.

  3. Click the reports you want to include in the composite report and then click Next.

    The wizard lists your choices.

  4. Click Finish.

    DataWindow Designer places boxes for the selected reports in the Design view. In this example, you see three reports:

    The sample shows three boxes in the Detail band of the design view. One at the top is labeled composite product sales. Below it are composite product on the left and composite sales reps on the right, with all text underlined.
  5. Select File>Save from the menu bar and assign a name to the composite report.

  6. Look at the Preview view of the report:
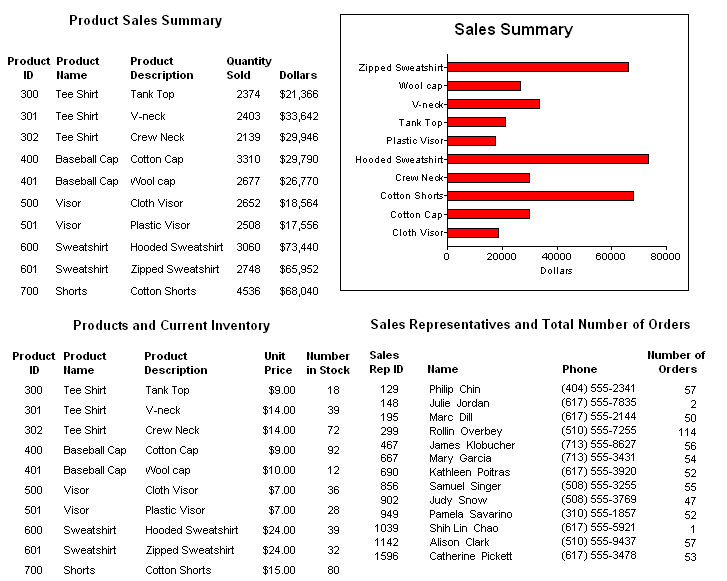
    The preview view displays a Product Sales Summary at top left with five columns of data and a bar graph at top right that plots dollar amounts from the Product Sales Summary on the x axis and product names on the y axis. Below is a Product and Current Inventory report of five columns on the left and a report labeled Sales Representatives and Total Number of Orders with four columns of data on the right.

    Notice that you are in print preview (which is read-only).

    NoteWorking with composite reports Many of the options available for working with reports, such as Rows>Filter, Rows>Import, and Rows>Sort, are disabled for a composite report. If you want to use any of these options, you need to access the nested report(s), where these options are available.

  7. Continue to enhance the composite report (for example, add a date and title).